Featured Post

Welcome to the Blog

Welcome to our Natural Disasters Blog!  Below you will post your disaster summaries as you complete them. Remember to initiate a post with t...

Thursday, October 22, 2020

2017 Pohang Earthquake - South Korea

Pohang, South Korea - 2017

     a day that shook a nation and its people -2017 Pohang earthquake intensity map.jpg

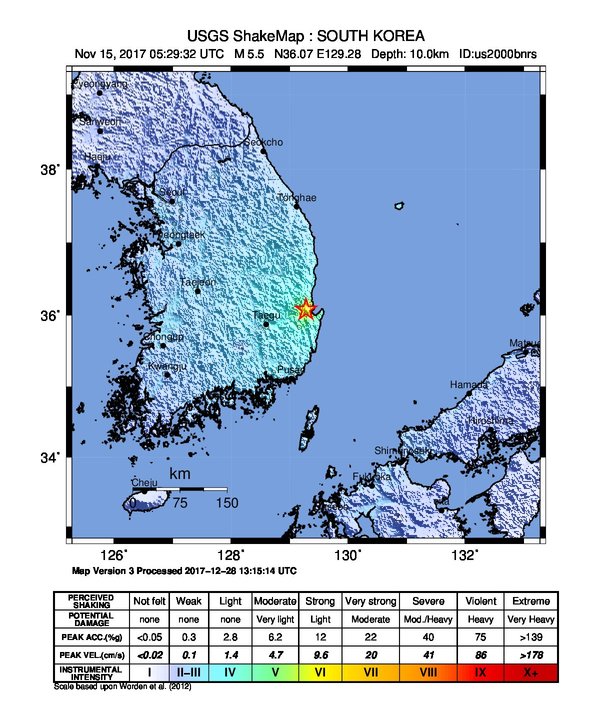
U. (2017, December 28). USGS ShakeMap: South Korea [Digital image]. Retrieved October 22, 2020, from https://commons.wikimedia.org/wiki/Category:2017_Pohang_Earthquake#/media/File:2017_Pohang_earthquake_intensity_map.jpg 

    When talking about earthquakes we rarely ever think about countries such as South Korea. To be fair South Korea also rarely have earthquakes. in the past 365 days, only 3 has accord. However, power is not to be underestimated. This year alone South Korea has seen earthquakes with magnitudes of 6.3 that's very significant. But today we're going to talk about the 2017 Pohang earthquake. 

See the source image   

 E. (2017, 15, November). [Wall crumbles onto car]. Retrieved October 22, 2020, from https://www.scmp.com/news/asia/east-asia/article/2120157/rare-quake-south-korea-left-1500-homeless-dozens-injured-and

     November 15, 2017, it was just like any other day in the southeast city of  Pohang. A city of about 516,000 residents. Until the 5.5 magnitude earthquake struck. It struck the city with enough force to crumble walls, crack roads, and collapse old buildings. causing over 90 people to have injuries and causing over $52 million in economic damages. Not only were man-made structures damaged but so was the land.  Fissures were open due to this high magnitude earthquake. At the time it was the 2nd strongest earthquake South Korea has experience after starting to monitor them in 1978. The state-run Korea Meteorological Administration said the epicenter was inside Pohang while the US Geological Survey said it was centered about 9.3 kilometers northwest of the port city. This conflicting information is actually very important to this story. The people of Pohang actually sued the state due to this earthquake being quote "mad made". People were lead to believe the earthquake was caused in part due to the influence of the local industrial activities the state was taking in part in. In the area, the government was using high-pressure hydraulic injection for the past 2 years for a geothermal power generator. Which is known to raise the possibility of an earthquake. The location that was chosen is a very enhanced geothermal system site, so it's very highly that the earthquake was in part anthropogenic in nature. Without a doubt this highly impactful event could have been mitigated by the government it chose not to set up a geothermal plant, instead, it did. But the fact doesn't change how they reacted afterward. South Korea is a very efficient country when it comes to helping its people in a crisis. Due to building codes and public knowledge people were at a lower vulnerability than say Haiti. See the source image

[Digital image]. (n.d.). Retrieved October 22, 2020, from https://www.gettyimages.com/photos/south-korea-posco-steel-plant?mediatype=photography&phrase=south%20korea%20posco%20steel%20plant&sort=mostpopular

 This video shows the perspective of everyday residents. Damages are extensive and costly to not only buildings and structures thought this city but everyday Koreans. about 1,500 people were left homeless. Luckily no deaths were reported. 

     The Social Fallout From Pohang’s ‘Man-Made’ Earthquake
The Diplomat [Digital image]. (2017, November 18). Retrieved October 22, 2020, from https://thediplomat.com/2019/12/the-social-fallout-from-pohangs-man-made-earthquake/

    In the end, this earthquake could have been very dangerous if the country wasn't as modern as it is today. I still believe the country needs to take more steps into protecting its people's best interest and also its economic ones. Yet I feel as if they knew what would happen. The science indicates that making geothermal generators on seismically active areas will indirectly cause earthquakes. The government found that out the hard way. 


Citation 

Grigoli, F., Cesca, S., Rinaldi, A., Manconi, A., López-Comino, J., Clinton, J., . . . Wiemer, S. (2018, June 01). The November 2017 Mw 5.5 Pohang earthquake: A possible case of induced seismicity in South Korea. Retrieved October 23, 2020, from https://science.sciencemag.org/content/360/6392/1003.full

Paul VoosenApr. 26, 2., Peter Behr, E., Lindzi Wessel, R., Pratik PawarOct. 20, 2., Scott Waldman, E., Rebekah Tuchscherer, R., . . . Rasha AridiSep. 23, 2. (2018, April 30). Second-largest earthquake in modern South Korean history tied to geothermal plant. Retrieved October 23, 2020, from https://www.sciencemag.org/news/2018/04/second-largest-earthquake-modern-south-korean-history-tied-geothermal-plant

Recent Earthquakes Near South Korea. (n.d.). Retrieved October 23, 2020, from https://earthquaketrack.com/p/south-korea/recent

Yesterday's earthquake in South Korea was the second-strongest the country has ever been hit by. (2017, November 16). Retrieved October 23, 2020, from https://www.independent.co.uk/news/world/asia/south-korea-earthquake-latest-pohang-quake-second-strongest-record-5-4-magnitude-a8057946.html

Staff, S. (2019, March 20). Geothermal plant 'triggered earthquake' in S. Korea. Retrieved October 23, 2020, from https://phys.org/news/2019-03-geothermal-triggered-earthquake-korea.html


2011 Tohoku, Japan Earthquake and Tsunami

    On March 11, 2011, at 2:46 pm Eastern Standard Time, the largest recorded earthquake to ever hit Japan occurred 231 miles northeast of Tokyo, in the region of Tohoku. Originally recorded at an 8.9, the magnitude was later upgraded to a 9.1 (CNN, 2020). About an hour later, at approximately 4:00 pm, a tsunami generated in the Pacific Ocean overtook the coast of Japan, killing over 15,800 people, and leaving almost 3,000 unaccounted for (NOAA, 2011. CNN, 2020). The aftermath of the catastrophe is ongoing as of 2020.

    The earthquake that generated the tsunami which resulted in the death of thousands of people in Tohoku, Japan, was a result of thrust faulting on or near the subduction zone interface plate boundary between the Pacific and North America plates (NOAA, 2011). According to the National Oceanic and Atmospheric Association (NOAA), the location and depth are consistent with the action of the Pacific Plate thrusting under the Japan Trench, located beneath Japan (NOAA, 2011). This subduction of the Pacific Plate was the source of the massive 9.1 magnitude earthquake which would ultimately result in the catastrophic tsunami. 

    People began feeling the large foreshocks on March 9th, two days prior to the 9.1 M earthquake which occurred on March 11th. The largest foreshock felt on March 9th was a 7.8 M about forty kilometers from where the March 11th earthquake took place (NOAA, 2011). About an hour after the 9.1 M earthquake hit, a tsunami with waves reaching up to 130 feet enveloped the Tohoku region of Japan, taking out everything in its path for over 2000 kilometers (Mori et al. 2011). According to witnesses, shortly after the waves had subsided, it began to snow, which was interpreted by survivors as a cruel sign that nature shows no mercy (Meurer, 2020). 

    The majority of death and destruction which occurred as a result of this combination of natural disasters were ultimately caused by the tsunami, rather than the earthquake. As of 2015, there were 15,890 confirmed deaths, 2,590 missing, and 6,152 injuries as a result of the tsunami (NOAA, 2011). Further, the tsunami resulted in the loss of homes for 450,000 individuals, destroyed thousands of businesses, and devastated the Japanese infrastructure (National Geographic Society, 2020). The tsunami was also the direct cause of an event known as the Fukushima Nuclear Disaster, which consisted of the meltdown of three nuclear reactors at the Fukushima Daiichi Nuclear Power Plant, wherein toxic, radioactive materials were released into the environment, forcing thousands to evacuate their homes and businesses immediately (National Geographic Society, 2020). This event alone will have ecological impacts for decades, if not centuries.

   In fact, several of the residual effects of this catastrophe will likely take lifetimes to

overcome. Virtually all infrastructural, economic, and biological resources that existed in Tohoku, Japan before March 11th, 2011 were demolished that day, leaving survivors no choice but to either leave permanently or to come back and start over from scratch. The roads, plumbing, and electrical systems which had been the basis of the region’s society were not only no longer functional, but no longer existed. The economic destruction imposed upon the community was devastating based on the amount of damage alone, but when the loss of businesses and assets which took place on such a massive scale is also taken into consideration, the severity of the situation starts to set in. The damage caused to the local environment was insurmountable, and continues to have implications for remote locations as well. The Japanese government estimates that the tsunami swept about five million tons of debris offshore, and that 70% sank, leaving 1.5 million tons of debris floating in the Pacific Ocean (CNN, 2020). With the percentage of plastics and other pollutants in the Pacific already  increasing at a rapid rate and breaking down to nanoparticles which can thereby be consumed by aquatic organisms, eventually working their way up trophic levels and reaching the top consumers, humans, this could potentially contribute to adverse health effects in species all across the globe for years to come. 


Tsunami waves overtopping seawalls in Iwate Prefecture, Japan (Taylor, 2016).


Cars and airplanes swept by a tsunami sit among debris at Sendai Airport (Taylor, 2016).


Houses burn at night following the tsunami in Natori City (Taylor, 2016).


2011 Japan Earthquake - Tsunami Fast Facts. (2020, June 02). Retrieved October 23, 2020, from https://www.cnn.com/2013/07/17/world/asia/japan-earthquake---tsunami-fast-facts/index.html

Meurer, T. (2020). Tsunami Spirits. Unsolved Mysteries. Volume 2, Episode 4. Netflix.

Mori, N., Takahashi, T., Yasuda, T., & Yanagisawa, H. (2011). Survey of 2011 Tohoku earthquake tsunami inundation and run-up. Geophysical Research Letters, 38(7). doi:10.1029/2011gl049210

National Geographic Society. (2014, May 16). Tohoku Earthquake and Tsunami. Retrieved October 23, 2020, from https://www.nationalgeographic.org/thisday/mar11/tohoku-earthquake-and-tsunami/

Taylor, A. (2016, March 10). 5 Years Since the 2011 Great East Japan Earthquake. Retrieved October 23, 2020, from https://www.theatlantic.com/photo/2016/03/5-years-since-the-2011-great-east-japan-earthquake/473211/

United States, National Oceanic and Atmospheric Administration, National Geophysical Data Center. (n.d.). MARCH 11, 2011 JAPAN EARTHQUAKE AND TSUNAMI.


The Great Sichuan Earthquake of 2008


This photo was taken in the town of Qushan following 
the quake. The area was almost completely destroyed
by debris flow. 
(Credit: David Wald, USGS. Public domain.)

        Sichuan is a large province in southwestern China and is the fourth most populated province in the country with its population of over 81 million people. Its capital city,  Chengdu, is located in the central part of the province on the Min River. On May 12, the province of Sichuan was struck by an immense 7.9 magnitude earthquake, the effects of which were catastrophic. The quake began at 2:28 P.M. and lasted around two minutes. Over 87,000 people were killed and another 370,000 were left injured from the earthquake and its aftermath. The quake cost China and its people an estimated $86 billion in damages and left 5,000,000 homeless, making this earthquake one of the most devastating natural disasters in modern China's history.                    

        The earthquake was caused by the collision of the Indian and Eurasian plates. This tectonic collision has been slowly playing out for over tens of millions of years and has created immense strain and deformation in the region between the two plates along the Longmenshan thrust fault. It is this strain that caused the earthquake that devastated Sichuan. The epicenter of the quake was located just   
This map displays the levels of perceived shaking felt by
Sichuan province during the quake 
( Credit: Encyclopædia Britannica, Inc.)  
over 50 miles northwest of the capital city of  Dujiangyan. The map below displays the  perceived shaking of the quake as it grows in  intensity from the epicenter. You can see that  the city of Dujiangyan is almost directly atop  the epicenter and as a result it experienced  some of the most intense shaking. Naturally,  this was one of the areas that was severely  damaged by the quake. Hundreds of dams  were also damaged in the areas that  experienced strong to severe shaking, two of  which were major dams. At least 200 relief  workers were killed from mudslides while  attempting to channel water out of the dams  to prevent major flooding. 


This is a photo taken of Dongqi Middle School following its
 collapse after the quake. 
 (Credits: Shiho Fukada for The New York Times)


        Perhaps the most heart-wrenching and controversial losses were those of the estimated 5,000 students who died in the hundreds of schools that collapsed from the quake. At first, these losses were claimed to have been a result from the sheer magnitude of the quake by some Chinese authorities. But, due to mass protests by parents of the deceased children and other concerned Chinese citizens the issue of these schools collapsing were finally addressed by Ma Zongjin, who served as chairman of the official committee tasked with assessing damages from the quake. Ma stated that many of the schools collapsed at such a disproportionate rate compared to other buildings in the same areas as a result of poor construction quality and poor construction materials.  
        Much of this devastation could have been mitigated if proper measures had been in place to ensure that these schools were built with better quality resources and safer building techniques. This earthquake and the devastation it brought upon the people of Sichuan should serve as a testament of the need for buildings, especially schools and hospitals, to be constructed with ample support to protect those inside in the event of an earthquake. As many researchers who were at these sites have said, if the buildings were even strong enough to withstand the quake for just moments longer it could have given the students and faculty enough time to evacuate, saving thousands of precious lives.


This news segment first aired in 2008 following the 
quake. The short clip shows American earthquake 
engineers examine the rubble of a school that was
destroyed by the quake.

  Sources

Hu, C. Y. (Dec. 4, 2017). Sichuan. Encyclopædia Britannica.

    https://www.britannica.com/place/Sichuan

                    Calais, E., L. Dong, M. Wang, Z. Shen, and M. Vergnolle, Continental 

                                deformation in Asia from a combined GPS solution, Geophysical 

                                Research Letters, 33, 2006.

                    Rafferty J. P. (May 28, 2020) Sichuan Earthquake of 2008. Encyclopædia

   Britannicahttps://www.britannica.com/event/Sichuan-earthquake-of-2008

                    Wald, D. (May 12, 2008) Damage from 2008 Great Sichuan Earthquake in China.                                             USGS, https://www.usgs.gov/media/images/damage-2008-great-sichuan-                                                 earthquake-china

                    Wong, E. (Sep. 4, 2008) China Admits Building Flaws in Quake. The New York                                                      Times https://www.nytimes.com/2008/09/05/world/asia/05china.html


Krakatau eruption and tsunami, Indonesia (August 26-27, 1883)

Figure 1. An 1888 lithograph of the eruption of Krakatau. Source: mentalfloss.com
  
 
The volcano Krakatau is located on the island of Rakata, which is part of the Indonesian Island Arc and is located in the Sunda Strain between Java and Sumatra (Augustyn). Starting on August 26th and ending in August 27th of 1883, Krakatau erupted, sending nearly five cubic miles of rock fragments into the air and causing a series of tsunamis that were recorded as far away as South America and Hawaii (Augustyn). The eruption, assigned a rating of six on the Volcanic Explosion Index, released an estimated eleven cubic miles of debris into the atmosphere that darkened the skies within 275 miles of the volcano for three days (Bagley). More than 36,000 people were killed as a result of the eruption, with around 5,000 deaths coming from the initial eruption (History.com Editors). This eruption sent out pyroclastic flows containing a high-density mix of hot lava blocks, pumice, and volcanic ash (NCEI) that stretched across the sea as far as forty miles, scorching everyone in its path (History.com Editors). Though the initial eruption had many casualties, it does not begin to stand up to the severity of the ensuing tsunamis. After the eruption, much of the island of Rakata fell into the water (Figure 2) (Bagley). This event created waves as big as 120 feet tall that washed over nearby islands, stripping their vegetation and carrying many people out to sea (Bagley). These tsunamis destroyed 165 coastal villages in the surrounding areas and killed around 31,000 people (Bagley).
Figure 2. Island of Rakata before and after eruption. Source: researchgate.net

    Krakatau had major implications on the global climate in the years following the eruption. In 1884, the average global summer temperatures fell by around 2 degrees Fahrenheit (Figure 3) (Williams). Even five years after the eruption the average global temperature was still 1.2 degrees Fahrenheit below normal (Bagley). In addition, some regions experienced unusual weather. For example, areas in California recorded record amounts of rainfall between July 1st, 1883 and June 30th, 1884 (Williams). During this period, Los Angeles received 38.18 inches of rainfall which remains the wettest year on record for the city (Williams). 

Figure 3. Global temperature changes 1880-1890. Source: arcgis.com
    Mitigation efforts were limited at the time because not much was known about volcanic eruptions. Warning signs were showing months before Krakatau erupted. In May of 1883, the captain of a German warship reported seeing clouds of ash above the volcano (Bagley). Over the next few months leading up to the eruption, sightseeing boats travelled near the volcano and reported thundering noises and incandescent clouds (Bagley). These signs of an impending eruption could have allowed citizens in surrounding areas to evacuate if they were in close proximity to the actual volcano, or at least be prepared to travel to higher elevations as far inland as possible to protect from the threat of tsunamis. 


This video talks about various points that I have mentioned in this blog. It discusses general information about Krakatau, early signs that an eruption was pending, the power of the eruption, and the global climate effects the eruption caused.


Works Cited

Augustyn, Adam. "Krakatoa." Britannica, 16 January, 2020, https://www.britannica.com/place/Krakatoa.

Bagley, Mary. "Krakatoa Volcano: Facts About the 1883 Eruption." LiveScience, 15 September,

        2017, https://www.livescience.com/28186-krakatoa.html#:~:text=The%20eruption%20of

        %20Krakatoa%2C%20or,more%20than%2036%2C000%20people%20died.&text=In%20M

        ay%201883%2C%20the%20captain,clouds%20of%20ash%20above%20Krakatau.

History.com Editors. "Krakatoa Explodes." History, 25 August, 2020, https://www.history.com/this-

        day-in-history/krakatau-explodes.

“On This Day: Historic Krakatau Eruption of 1883.” National Centers for Environmental Information 

        (NCEI), 23 August, 2018. https://www.ncei.noaa.gov/news/day-historic-krakatau-eruption-1883. 

Williams, Jack. "The Epic Volcano Eruption That Led to the 'Year Without a Summer.'" The Washington Post, 10 June, 

        2016, https://www.washingtonpost.com/news/capital-weather-gang/wp/2015/04/24/the-epic-volcano-eruption-that

        -led-to-the-year-without-a-summer/.

Wednesday, October 21, 2020

 Earthquake of Bam, Iran (December 26th, 2003)

The city of Bam is an ancient city in the Kermān Province of Iran that predates the birth of Christ, being traced back all the way to the Achaemenid Period (6th-4th Century B.C.E.). Being located along the banks of the seasonal Posht-e Rud River as well as right along the border of Pakistan, the city maintains high prominence as a trade and agricultural center in the Middle East. With all of the productivity and prosperity flowing through Bam, a single day in the city’s history completely reversed the evolution of this society. On December 26th, 2003, the deadliest earthquake in 21st Century Iran shook the landscape. 


Image 1. This image shows the Citadel of Bam and surrounding buildings prior to the 2003 earthquake (Researchgate.net).


On this seemingly normal Friday morning, 5:30 a.m. brought sheer horror to Bam, thousands losing their lives as the 6.6 magnitude earthquake struck. Within just around 30 minutes, more than 26,000 were dead along with another 30,000 injured or in critical condition. The Iranian Plateau, a major piece to the Eurasian Plate, includes cities such as Parthia, Media, Persis, as well as Bam. It’s placement, however, spells geological devastation for humans residing nearby. The position of the Iranian Plateau fits snuggly between the convergence of both the Arabian and Indian Plates, forcing the North/South strike-slip action that caused the Earthquake of 2003. This earthquake, like many others like it worldwide, found a way to display the impacts of poor disaster planning and overall preparedness by the city of Bam. According to the National Earthquake Information Center (NCEI), an earthquake of this magnitude and power occurs weekly on a global scale, but rarely ever sees this rate of fatality or injury (Manuel Berberian, 2009). While earthquake prediction is still not narrowed to an exact science even today, technological and educational capabilities had broadened enough in the early 21st Century for use on smaller scales. However, Bam is an example of a city whose minimal preparedness and mitigation resulted in affecting over 230,000 humans. The fault that caused the earthquake wasn’t even recognized until after the events that took place on December 26th. Almost all of the individuals who died were inside a building at the time of impact, also leaving just under 90% of the buildings in Bam with 60%-100% structural damage. The other 10% still managed to suffer anywhere from 40%-60% structural damage. After the aftershocks had rang throughout the province, a total of approximately 12 million metric tons of debris had piled up in the streets. Many of these buildings had been built in the previous 30 years, lacking any seismic codes that were available to be put into place, as well as buildings of poorly constructed masonry. This event even left roads, railways, and bridges shifting, curved, or broken. The environmental impacts of this earthquake can primarily be attributed to mishaps with human infrastructure. For example, the earthquake also managed to bend, crack, or break underground water lines that transported water from building to building and underground well to underground well. Once these pipes burst, irrigation and drinking water shortages occurred, as well as subsequent soil pollution and water contamination. The economic recovery of the city, stated by the World Bank, predicted that the economic recovery would take anywhere from 3 to 5 years, costing an estimated 1.5 million U.S. dollars. 


Image 2. This image displays the remains of the Citadel of Bam, as well as other buildings nearby, on December 30th, 2003 (Pbase.com). 


While this earthquake took substantial upfront rebuilding costs from the city of Bam, the lasting economic consequences were brutal. The direct economic loss was estimated by the World Bank to equal roughly 1.5 million U.S. dollars (as stated previously), as well as a total of $53 million (all values are in U.S. dollars) in agricultural losses, $30 million in tourism, $15.8 million in industry, and $91.3 million in private business. In addition to this, forty different nations (including the United Nations) sent relief in the form of 7 million U.S. dollars to Iran. Many other humanitarian groups within the Middle East also sent food, water, and other essential resources to the people of Bam and those affected. 


Image 3. This image shows a side-by-side of the before and after scenes of the city of Bam, Iran (Researchgate.net). 


Shockingly, within 24 hours of the earthquake’s strength, not a single search and rescue or rubble removing team was utilized by the Iranian government. These teams only saved a total of 22 individuals in their initial 48 hour search. The elements buildings were used to build with, the sheer weight of these materials, lack of government enforcement of seismic building codes, and the lack of knowledge and awareness are the main contributors to this disaster. Although earthquakes are not entirely common in this region, they can still happen. This earthquake just displays what can happen when the government downplays the severity of earthquake preparedness, and Iran just so happened to be under the conditions for a “perfect storm.”


Video 1. This video shows footage of the results of the Bam Earthquake, as well as firsthand accounts and narration of those affected.


 Sources:

Centre, U. (n.d.). Bam and its Cultural Landscape. Retrieved October 22, 2020, from https://whc.unesco.org/en/list/1208/

Electricpulp.com. (n.d.). Encyclopædia Iranica. Retrieved October 22, 2020, from https://iranicaonline.org/articles/bam-earthquake-2003

Fathi, N. (2003, December 27). Powerful Earthquake in Iran Kills Thousands. Retrieved October 22, 2020, from https://www.nytimes.com/2003/12/27/world/powerful-earthquake-in-iran-kills-thousands.html

Manafpour, A. R. (n.d.). THE BAM, IRAN EARTHQUAKE OF 26 DECEMBER 2003. Retrieved October 22, 2020, from https://www.preventionweb.net/files/2770_Ali20Manafpour20Bam20report20pre20review.pdf

Organization. (2017, December 27). On the occasion of 2003 Bam earthquake. Retrieved October 22, 2020, from https://www.tehrantimes.com/news/419753/On-the-occasion-of-2003-Bam-earthquake

Platform, I. (n.d.). Bam Earthquake, 2003 - Countries & Disasters. Retrieved October 22, 2020, from https://www.recoveryplatform.org/countries_and_disasters/disaster/35/bam_earthquake_2003

2018 Fuego Volcano Eruption, Guatemala

Depiction of the size and direction of the pyroclastic flow caused by the eruption of the Fuego Volcano. 

 On Sunday, June 3rd, 2018, the Fuego volcano in Guatemala erupted becoming the most violent volcano in the country in more than a century. The eruption lasted for 16 hours, spewing volcanic ash, mud, and rocks burying villages along the slope of the volcano. Fast-moving pyroclastic flows hit multiple villages and killed more than 62 people. The head of the country’s Natural Disaster Management Agency said the entire town of El Rodeo had been completely buried. Temporary shelters were set up for the regions almost 3000 residents who were evacuated. Ash spewed nearly 4 miles into the air it is also estimated that The eruption spread more than 10 km down slope of the volcano crater. Villages, coffee farms, and a golfer sort of fell victim to the pyroclastic flow‘s of hard to assemble can a crock. It is estimated that the landslide travel between speed of 30 mph to 90 mph and up to 1300°F. The airport was also shut down because of the large amount of ash in the atmosphere. Ash the volcano was also found about 27 miles west in the capital, Guatemala City. 


This video shows images and accounts of the volcanic explosion. They interview people who were impacted by the volcano and its impact on the region. 

There were many prevention methods that Guatemala’s government could have put in place that could have lessen the impact of the volcanic eruption. Blindspots in forecasting the volcanoes irruption may have been created because of two main problems. First, the Fuego volcano has been constantly active throughout the years. In 2015, the volcano caused a small evacuation of 100 people, and it also erupted  for 20 hours in January before the devastating eruption in June 2018. This high level of activity makes it difficult to predict when larger, more violent explosions are going to occur. The second blindspot in forecasting the volcano’s eruption occurred because there was only one seismometer on the volcano. They had a very basic monitoring system, whereas other volcano monitoring sites use a combination of seismometers, gas meters, and pressure sensors to predict volcanic eruptions.

Citations

Akpan, Nsikan. “What Made Guatemala's Fuego Volcano Eruption so Deadly?” PBS, Public Broadcasting Service, 4 June 2018, www.pbs.org/newshour/science/what-made-guatemalas-fuego-volcano-eruption-so-deadly. 

“Guatemala Volcano: Dozens Die as Fuego Volcano Erupts.” BBC News, BBC, 4 June 2018, www.bbc.com/news/world-latin-america-44350974. 

Lakhani, Nina. “Guatemala Volcano: at Least 62 Killed and 300 Injured after Fuego Erupts.” The Guardian, Guardian News and Media, 4 June 2018, www.theguardian.com/world/2018/jun/04/guatemala-fuego-volcano-erupts-dead-missing. 

Neuman, Scott, and Colin Dwyer. “'Everything Is A Disaster': Guatemala's Fuego Volcano Erupts, Killing At Least 69.” NPR, NPR, 4 June 2018, www.npr.org/sections/thetwo-way/2018/06/04/616715243/at-least-25-people-killed-in-guatemala-volcano-eruption. 

Wallace, Tim. “The Guatemala Volcano Eruption: Before and After a Deadly Pyroclastic Flow.” The New York Times, The New York Times, 7 June 2018, www.nytimes.com/interactive/2018/06/07/world/americas/guatemala-volcano-eruption.html. 


Thursday, October 8, 2020

Eyjafjallajökull 2010 Eruption


    For a couple decades, there has been deep and irregular seismic activity between the volcanoes Eyjafjallajökull and Katla; however, in January of 2010, the activity had progressively become shallower and more localized.  During that time, GPS stations began to notice a lift in the southeast portion of Eyjafjallajökull, the rate of which increased through time between January and March (Keller et al., 2019). The subglacial Icelandic volcano (Rafferty, 2020) began erupting on March 20th, 2010, and was not considered over until October 2010 (Keller et al., 2019). There were two stages in the eruptions; on March 20th, 2010, the effusive eruptions began; then, it became explosive on April 15th, 2010 (Keller et al., 2019). The eruptions that began in March were through a 500m fissure vent on the east of its caldera, and it erupted for three weeks, during which a second vent opened 200m northwest of the first, but the volcanic lift had not yet begun to subside (Keller et al., 2019). Seismic activity increased, and lava flow stopped on April 12th, then 48 hours later, an explosive eruption underneath Eyjafjallajökull’s ice cap occurred, immediately prompting Jökulhlaups (a glacial outburst flood), emergency response plans (Keller et al., 2019). This eruption sent steam, ash, and other gases almost 11km in the atmosphere, where winds carried everything in the ash plume over the North Atlantic Ocean, threatening northern Europe’s airspace (Rafferty, 2020). The explosive eruption caused Jökulhlaups, volcanic lightning, and ash clouds, which had a number of human-environment impacts, including evacuations (at least 800 people), property damage (to infrastructure and farms), toxic water-soluble fluoride from the ash threatened the lives of people and livestock, the largest of which was grounding planes and halting air travel for at least six continuous days, which cost companies billions and stranded many travelers (Keller et al., 2019).

This video shows a 48-hour time lapse of Eyjafjallajökull between May 1st and 2nd of 2010. It shows many of the hazards associated with volcanoes, including glacial flooding and the ash clouds, as well as several human environmental impacts, including ash covered fields, the proximity to homes, and footage of a plane wreck.

    Iceland has around 200 volcanos of different types (Britannica, 2020) as it is uniquely located on top of a hotspot in the middle of the mid-Atlantic ridge (Keller et al., 2019). The Eurasian and North American Plate are slowly and surely pulling the island apart as they move away from each other (Keller et al., 2019).  Because Iceland has tenure with natural hazards like earthquakes and volcanoes, the country and its residences must always be prepared. Although more often than not, the volcanic eruptions on Iceland are effusive and register no more than one on the Volcanic Explosivity Index (VEI), they have a full-scale evacuation plan for a major eruption of Katla, Eyjafjallajökull’s eastern neighbor. The eruption of Eyjafjallajökull in 2010 was a four on the VEI (Global Volcanism Program, 2013); however, I was unable to find if they had an emergency response plan for Eyjafjallajökull. Eyjafjallajökull has only erupted a total of three times in the last 1,000 years (1612, 1821, 2010) (Rafferty, 2020), so the lack of an emergency response plan might have been deliberate; however, both eruptions before 2010 either occurred with or was shortly followed by an eruption from Katla (Rafferty, 2020). When Eyjafjallajökull erupted violently, sending a column of ash in the air, it immobilized 313 airports, stranded nearly 10 million travelers, and grounded over 100,000 flights (USGS, 2010). Direct and secondary damage the ash plume caused industries depending on air travel a loss that may have exceeded 5 billion (USGS, 2010). For the 30 years preceding 2010, mitigation involving airlines in airspace containing volcanic ash (with its gases, particles, and aerosols) has been to avoid them. The disruption from Eyjafjallajökull’s ash cloud caused around Europe (and globally) has prompted new strategies to be considered, so this situation isn’t repeated (USGS, 2010).


This is a photo of Eyjafjallajökull taken in 1992. The purpose is to show the glacier at the top, the topography and shape of the stratovolcano before it's 2010 eruption. (Global Volcanism Program, 2013 
https://volcano.si.edu/volcano.cfm?vn=372020)


This was chosen as reference to Iceland’s geography and location in the Northern Atlantic ocean as well as the location of the Eyjafjallajökull volcano (Global Volcanism Program, 2013).

This shows the eruption from space. You can see the grey ash cloud, and the relief of the island. https://www.huffpost.com/entry/volcanoes-from-space-nasa_n_1098467


Sources:

Britannica. 2020. Iceland. September 14. (Accessed 10/21/2020 https://www.britannica.com/place/Iceland)

Global Volcanism Program, 2013. Eyjafjallajokull (372020) in Volcanoes of the World, v. 4.9.1 (17 Sep 2020). Venzke, E (ed.). Smithsonian Institution. Accessed October 21, 2020 (https://volcano.si.edu/volcano.cfm?vn=372020).

Keller, Edward A., DeVecchio, Duane E. Natural Hazards Earth’s Processes as Hazards, Disasters, and Catastrophes. 2019. Routledge Publishing. 5th Edition

Rafferty, John P.  2020. Eyjafjallajökull volcano. Encyclopædia Britannica. (Accessed 10/21/20 https://www.britannica.com/place/Eyjafjallajokull-volcano)

USGS. 2010. Volcano Watch – New task force charged with evaluation avaiation procedures for volcanic ash. November 4. (Accessed 10/21/20 https://www.usgs.gov/center-news/volcano-watch-new-task-force-charged-evaluating-aviation-procedures-volcanic-ash)

1933 Sanriku Earthquake and Tsunami

On March 2, 1933, at approximately 5:30PM, an 8.4 magnitude earthquake occurred about 180 miles off the Sanriku Coast, quickly traveling towards the city of Honshu, Japan (USGS). This earthquake then triggered a tsunami, which was the truly devastating blow. The tsunami produced waves which in some areas were recorded to be up to 94 feet high (USGS). The actual shocks of the earthquake only occurred at or less than 50km or 31 miles underneath the surface of the ocean (Uchida et al., 2016) Due to this earthquake/tsunami duo, there were an estimated 3,000 deaths (USGS). This tsunami not only injured or killed individuals, it also resulted in over 8,000 homes being either damaged or entirely washed away by the massive incoming waves (USGS). The tsunami had also reached part of Hawaii and caused some damage there, though the earthquake had been detected offshore and an evacuation was held, leading to minimal structural damage and no recorded deaths (Okal, Kirby and Kalligeris). The 1933 Sanriku earthquake would continue to produce aftershocks for months after the original occurrence (Fig 2.), some of them even coming in at a magnitude of 6 (Okal, Kirby and Kalligeris, 2016). This earthquake has been since been recognized as one of the largest and most devastating  natural disasters in Japan’s history (Live Science, 2011). 


Figure 1: Damages done by the 1933 Sanriku Earthquake and Tsunami. (Source: Ferreira, Leandro. “1933 Disaster Photos Are Listed as Cultural Assets,” April 25, 2019. https://en.connectionjapan.com/2019/04/25/fotos-do-desastre-de-1933-sao-listadas-como-bens-culturais/.


Figure 2: Map of main shock (labeled MS) and aftershocks. Graphs a and b show what were thought to be the original positions and depths of the shocks, while graphs c and d show the positions and depths of the shocks after 3-D modeling. Please reference article for more details. (Source: Naoki Uchida, Stephen H. Kirby, Norihito Umino, Ryota Hino, Tomoe Kazakami, The great 1933 Sanriku-oki earthquake: reappraisal of the main shock and its aftershocks and implications for its tsunami using regional tsunami and seismic data, Geophysical Journal International, Volume 206, Issue 3, 1 September 2016, Pages 1619–1633, https://doi.org/10.1093/gji/ggw234). 

This earthquake and tsunami duo was not the first of its kind in this area. 1896 saw a natural disaster (Fig. 3) that was just as, if not more devastating than the one which is the subject of this blog. The earlier disaster saw the death of over 25,000 individuals with a 8.5 magnitude earthquake and reported 80 feet tall waves (U.S Geological Service). It was said to have “instantly swept away all houses and people when it reach land” (U.S. Geological Survey). This tsunami too affected Hawaii, though in this case, there was much more damage done than in the case of the 1933 Sanriku earthquake (U.S. Geological Survey). When comparing these events, one can see some major differences. While the 1896 earthquake had nearly the same magnitude and smaller waves than the event in 1933, we can see that there were more reported damages in not only Japan, but also in Hawaii. This fact by itself can lead one to believe that the individuals living near the Sanriku Coast began to better prepare themselves for events like this, though things infrastructure and education. The U.S. Geological Survey even has a quote claiming that the 1896 event was what really pushed Japan to start studying events like tsunamis, which could have greatly impacted their preparedness for future events, such as the 1933 Sanriku disaster (U.S. Geological Survey). In terms of things that could have been done in order to mitigate the damages done by the 1933 Sanriku earthquake and tsunami, there are a few things on the list. One of the most important things that could have been done is to educate the public. Recognizing signs of a tsunami could be vital to having time to get to higher ground. Then comes a warning system. One of the major reasons there were no deaths in Hawaii during the tsunami in 1933 was because of the evacuation that took place since ample warning was given. Some kind of warning could have saved many individuals in Honshu and the surrounding areas. Finally is reinforcing structures. Adding reinforcements to preexisting structures could help them to not be completely destroyed during an earthquake and a sort of sea wall could have helped slightly in terms of the following tsunami. 


Figure 3: Damages done by the 1896 Sanriku Earthquake and Tsunami (source: Numata, K. (2014, March 26). Images of 1896 Sanriku quake found. The Japan Times. https://www.japantimes.co.jp/news/2014/03/26/national/history/images-of-1896-sanriku-quake-found/.)


This natural disaster greatly affected the residents of the Sanriku Coast and has left its mark on not only the history of Japan but on the geological history of the world. 


Video: This video shows footage taken after the 1933 Sanriku Earthquake and Tsunami occurred. It shows the damages done to the land and structures of Kamaishi, Japan (noise warning). 


Sources


Emile A. Okal, Stephen H. Kirby, Nikos Kalligeris, The Showa Sanriku earthquake of 1933 March 2: a global seismological reassessment, Geophysical Journal International, Volume 206, Issue 3, 1 September 2016, Pages 1492–1514, https://doi.org/10.1093/gji/ggw206

Ferreira, Leandro. “1933 Disaster Photos Are Listed as Cultural Assets,” April 25, 2019. https://en.connectionjapan.com/2019/04/25/fotos-do-desastre-de-1933-sao-listadas-como-bens-culturais/.

Live Science. “Japan's Biggest Earthquakes,” April 8, 2011. https://www.livescience.com/30312-japan-earthquakes-top-10-110408.html.

Naoki Uchida, Stephen H. Kirby, Norihito Umino, Ryota Hino, Tomoe Kazakami, The great 1933 Sanriku-oki earthquake: reappraisal of the main shock and its aftershocks and implications for its tsunami using regional tsunami and seismic data, Geophysical Journal International, Volume 206, Issue 3, 1 September 2016, Pages 1619–1633, https://doi.org/10.1093/gji/ggw234

Numata, K. (2014, March 26). Images of 1896 Sanriku quake found. The Japan Times. https://www.japantimes.co.jp/news/2014/03/26/national/history/images-of-1896-sanriku-quake-found/. 

U.S. Geological Survey. Today in Earthquake History. U.S. Geological Survey. https://earthquake.usgs.gov/learn/today/index.php?month=6.  

USGS “M 8.4 - 1933 Sanriku (Sanriku-Oki) Earthquake, Japan.” USGS Earthquake Hazards Program. USGS. https://earthquake.usgs.gov/earthquakes/eventpage/official19330302173100_30/impact


2010 Haiti Earthquake

2010 Haiti Earthquake 

    January 12th, 2010 an intense earthquake struck Haiti, leaving many people homeless and injured. The epicenter of the earthquake was near Port-au-Prince seaport and the damage went on for miles. The earthquake itself, the shaking, only lasted around 35 seconds but did extensive damage to residential housing and businesses. The magnitude of the earthquake was a 7.0 on the Richter scale, meaning it was a highly powerful earthquake. There were aftershocks after the main earthquake; the aftershocks magnitudes were at a 5.9 and a 5.5 on the Richter scale (Pallardy 2010). Shocks could be felt in the surrounding areas such as the Dominican Republic, Cuba, and even Jamaica. An earthquake of this magnitude had not struck the Haiti area since the 18th century. The earthquake was caused by the North American Plate and the Caribbean plate. There was a small thrust along the Leogane fault line which was caused by rocks moving across the fracture. The earthquake did not occur very deep below the earth’s surface which increased the shaking at the surface (Pallardy 2010). The earthquake took a huge toll on the human features of the country. Buildings that defined the landscape had fallen or collapsed (Pallardy 2010). Many people had been trapped under rubble from fallen buildings, some were rescued. 

Image 1: The epicenter of the 2010 Haiti earthquake. Encyclopædia Britannica, Inc.

Haiti is one of the poorest countries in the Western Hemisphere and the population was already suffering from economic, political, and poverty issues. An earthquake at this degree was not something the country could handle gracefully because they were already in a tough situation. Around 250,000 people were killed in the earthquake (Reid 2019). Another 300,000  people were injured and 5 million people were displaced from their homes (Reid 2019). To this year the country has still not fully recovered from this disaster (Kahn et al. 2020). Many buildings came tumbling down because the government had little to no building codes; many buildings were weak and poorly built and maintained. International aid was required in order to help the citizens of Haiti survive the devastating event and the poverty that followed (Pallardy 2010). Millions of dollars were poured into the economy, promises of new roads, and better infrastructure were given but the help and money tapered off and the citizens still continued to suffer from the aftermath (Kahn et al. 2020). It would have been beneficial to the country if there had been stricter building regulations; the country does sit on top of a fault line which means there is always the possibility of another violent earthquake. If another earthquake were to strike today, they would not be prepared for it.  

Image 2: Damage done by the mainshock, power lines, and buildings are down. Humaintyhouse.org 


Image 3: Houses destroyed by earthquakes. TheTelegraph.co.uk 


https://www.youtube.com/watch?v=Rsi-8FJz0QA&ab_channel=GlobalNews 

Video: Description of the 2010 Haiti earthquake. The description of the loss of life and the destruction of the lives of some of the poorest people in the world. In the weeks following the earthquake, international aid. 


Sources

“Disasters & Conflicts: Haiti. Earthquake, 2010.” Humanity House, 7 Feb. 2017, humanityhouse.org/en/rampen-conflicten-haiti-aardbeving-2010/.

Kahn, Carrie, and Jeffrey Pierre. “A 'Lost Decade': Haiti Still Struggles To Recover 10 Years After Massive Earthquake.” NPR, NPR, 12 Jan. 2020, www.npr.org/2020/01/12/794298546/a-lost-decade-haiti-still-struggles-to-recover-10-years-after-massive-earthquake.

“Massive Earthquake Strikes Haiti.” History.com, A&E Television Networks, 18 July 2011, www.history.com/this-day-in-history/massive-earthquake-strikes-haiti.

Pallardy, Richard. “2010 Haiti Earthquake.” Encyclopædia Britannica, Encyclopædia Britannica, Inc., 2010, www.britannica.com/event/2010-Haiti-earthquake.

Reid, Kathryn. “2010 Haiti Earthquake: Facts, FAQs, and How to Help.” World Vision, 27 Feb. 2020, www.worldvision.org/disaster-relief-news-stories/2010-haiti-earthquake-facts.