This video highlights the path of destruction of the tornado and the human toll of the storm. It features interviews with Joplin residents who lived through the storm and takes you on a tour of what is left of the city.
What Went Wrong?
Picture of the 2011 Joplin Tornado. Chosen to show the large size of the tornado.
What Happened?
On Sunday, May 22nd, 2011, an EF-5 tornado tore through the city of Joplin, Missouri. At approximately 5:17PM that day, the Weather Forecast Office in Springfield, Missouri issued a tornado warning with 19 minutes of lead time before the tornado was to enter Joplin (Edgell, 2011). With just under 20 minutes to prepare, residents of Joplin were alerted to the storm by sirens. At 5:41PM, the first sightings of the tornado were beginning to be reported. The storm produced an EF-5 (greater than 200 mph) tornado over Joplin (NOAA, 2012). The tornado path was 22 miles long, and was EF-4 to EF-5 strength for 6 miles (Israel, 2011). The storm was three-quarters of a mile wide with a 300-yard-wide hurricane-like eye (Israel, 2011). This storm along with others generated additional tornadoes, wind damage and flash flooding across far southwest Missouri. At 7:30PM, the first report of confirmed dead came in at an estimated 22 people. By the end of the tornado, 161 people had died, over 1000 injured, and around 8,000 structures were left badly damaged in the Joplin area (Edgell, 2011).The tornado damaged or destroyed 7,500 residences and 500 businesses, displaced 9,200 people, affected 5,000 employees, and generated 3 million cubic yards of debris (Karimi, 2016).
Picture of the timeline and path of the EF-5 Tornado that struck Joplin
Image of the St. John's Regional Medical Center. Chosen to show the severity of the storm that ripped through the city.
The Joplin tornado is the deadliest single tornado since modern record keeping began in 1950 and is ranked as the 7th deadliest in U.S. history. According to a federal assessment, however, a majority of Joplin residents ignored the tornado sirens and did not seek shelter (Currier, 2012). The NOAA found that instead of seeking shelter, most residents were self-assessing their own risk by looking outside or watching television broadcasts. Some Joplin residents expressed confusion over hearing two different tornado warning sirens in the 30 minutes before the tornado hit the city. City officials and weather reporting agencies are looking to find more effective ways to send out storm warnings,including sirens with different sounds, standardized color coding on television or online to distinguish the severity of storms and using social networking tools and mobile technology to provide more specific information on weather threats (Currier, 2012). Another tool that would have been helpful in reducing the amount of damage that was caused by the tornado would have been to mandate the building of safety rooms (reinforced rooms for safety during sever weather events) in houses. It is interesting to note, the city of Joplin decided to not require builders install these safety rooms in the houses being rebuilt due to damage done by the tornado (Smith and Sutter, 2013). The city government believed that it was up to the individual businesses and residents to decide to create these rooms if they wanted them. The government believed that the extra cost of building these rooms would slow down the rebuilding of the city remove bureaucratic barriers (Smith and Sutter, 2013).
Edgell, Holly. “Timeline: The May 22, 2011 Joplin Tornado.” KSHB, KSHB, 22 May 2016, www.kshb.com/news/state/missouri/timeline-the-may-22-2011-tornado-that-laid-waste-to-joplin-mo.
Karimi, Faith. “Joplin, Missouri, Tornado: 5 Years Later.” CNN, Cable News Network, 22 May 2016, www.cnn.com/2016/05/22/us/joplin-tornado-anniversary/index.html.
NOAA. “Remembering Joplin Tornado.” National Weather Service, US Department of Commerce , 22 May 2012, www.weather.gov/news/052212-joplin.
Smith, Daniel J., and Daniel Sutter. “Response and Recovery after the Joplin Tornado: Lessons Applied and Lessons Learned.” The Independent Review, vol. 18, no. 2, 2013, pp. 165–188. JSTOR, www.jstor.org/stable/24563306. Accessed 12 Dec. 2020.
Hurricane Sandy was a hurricane which began on October 22, 2012 in the Caribbean and moved north towards the United States where it made landfall on October 28, 2012 along the coast near Atlantic City, New Jersey before finishing October 29, 2012 (National Weather Service, 2020).
Hurricane Sandy is said to be one of the most costly and devastating hurricanes in the history of the United States (CNN 2020). Often called “Superstorm Sandy,” it was, at the time, the largest storm ever recorded in the Atlantic Ocean (Manuel 2013). Even compared with Hurricane Katrina, they appeared to have similarly strong winds, Sandy affected a much broader area (Voiland 2012). This hurricane caused damages in 24 US States, the Caribbean, and even parts of Canada, causing $74.1 billion of damages (CNN 2020). Sandy was also responsible for over 200 deaths spread these areas previously mentioned (CNN 2020). Most of the destruction in the Eastern United States came from the storm surges with water being reported reaching 12.5 feet at its highest (Manuel 2013). Many individuals were moved into shelters as their homes were destroyed not only by the water and winds but also a fire which broke out due electrical surges (Manuel 2013). Even weeks after the storm, there was still a loss of power. During the storm, electricity was lost in 21 states, affected over 8.5 million people (Manuel 2013). This greatly affected those in hospitals and various medical centers, some of whom went weeks without critical medications that could not be accessed (Manuel 2013). Clearly this was a devastating storm which appears to have taken one of the most destructive paths possible, just gliding along the majority of the East Coast of the United States before finally making landfall. It is hard to say if it would have caused the amount of damage seen if it had made landfall earlier on which would have inevitably weakened the winds without the warm source of water.
The track of Hurricane Sandy. Source: National Weather Service, 2020
Storm surge levels along part of the East Coast (New Jersey, Connecticut, and others). Source: National Weather Service, 2020
As stated above, the damage caused by Hurricane Sandy was beyond words and destroyed many homes and lives in many different regions. There are measures which can be taken to try and mitigate some of the effects of events like hurricanes, but there is really nothing that can be done to completely prevent an event like this occurring. Some preventive measures were already in place when Hurricane Sandy occurred, but even these did not work as well as intended. It is perhaps most important that the area in the path of the storm be evacuated, but path taken by Sandy was unprecedented, and the storm surges occurred when the tide was highest on the East Coast of the United States (National Weather Service 2020). It is also important to secure the protection of things like electricity and water treatment as these are often disrupted or damaged during severe storms. Which is exactly what happened here. Backup generators failed and 80 sewage treatment systems in New York state lost power or were damaged, causing an issue with securing clean water (Manuel 2013). In areas which are often hit with hurricanes which can cause additional flooding, it is important to implement certain building codes to assure the least amount of damage possible. Areas which are often affected tend to have houses raised from the ground so the home will not flood. However, the East Coast is not hit as often so precautions like this were not implemented as widely. Many homes were destroyed, leading to further water and air pollution, while others were flooded and subsequently were affected by mold (Manuel 2013). The only other thing to do is try and have aid prepared for after the disaster has happened. This was something that seemed to be carried out decently, with the Red Cross sending out over 1,000 workers to the East Coast to assist and the United States government allotting $60 billion as a relief fund (Bucci et al. 2013). Overall, there were efforts that could have been taken in order to mitigate some of the effects of Hurricane Sandy, but with the unprecedented nature of this storm which was a, for lack of better terms, a perfect storm of events, I don’t know what more could have been done to avoid some of the damages which occurred.
Flooding and damages at Point Pleasant Beach, New Jersey on November 7, 2012, 9 days after the end of the storm. Source: Manuel, 2013
This video shows some of the destruction during and after Hurricane Sandy from the news and victims of the storm. It shows just how much damage was caused from a variety of sources like flooding and fires.
Sources:
Bucci, S., D. Inserra, J. Lesser, M. Mayer, J. Spencer, B. Slattery, and K. Tubb. 2013. After Hurricane Sandy: Time to Learn and Implement the Lessons in Preparedness, Response, and Resilience. Homeland Security. https://www.heritage.org/homeland-security/report/after-hurricane-sandy-time-learn-and-implement-the-lessons-preparedness
CNN. 2020. Hurricane Sandy Fast Facts. CNN. https://www.cnn.com/2013/07/13/world/americas/hurricane-sandy-fast-facts/index.html.
Manuel, J. 2013. The Long Road to Recovery: Environmental Health Impacts of Hurricane Sandy. Environmental Health Perspectives 121.5
National Weather Service. 2020. Hurricane Sandy. National Weather Service. https://www.weather.gov/okx/HurricaneSandy.
Voiland, A. 2012. Comparing the Winds of Sandy and Katrina. Nasa. https://www.nasa.gov/mission_pages/hurricanes/archives/2012/h2012_Sandy.html
In Victoria, the Southernmost region of Australia, one of the most lethal fires in the country's history scorched the surface during the late summer of 2009. Over 400 fires burned to create a massive fire complex that affected 78 communities in the form of fatality and property damage (AIDR, 2014). Those communities that were affected most significantly included Beechworth, Bunyip, Churchill, Kinglake, Narre Warren, and Redesdale, all of which were either included in or reside nearby a national park or reserve (AIDR, 2014). As one of the deadliest, most damaging, and most expensive wildfire complexes the country has ever experienced, it only increases curiosity of how these fires will continue to grow and get worse at climate change continues to impact the planet.
Image 1. This image shows an Australian fire vehicle racing away from smoke and flames in Northeastern Victoria (The Advertiser).
On February 7th, 2009, a fire complex arguably worse than the infamous Ash Wednesday fires of Australia's past ignited the landscape. Leading up to Saturday the 7th, the country had been experiencing an intense and widespread heatwave, producing fuel that had been allowed 2 months to heat and dry out. This heatwave included some of the hottest days Australia had experienced at that point in time, as well (National Museum of Australia, 2020). As the sun rose on the morning of the 7th, north westerly winds exceeding 100 kilometers per hour covered the state with hot and dry air from central Australia. While the wind helped create the conditions for the "perfect fire" to ignite, it also forced powerlines to collapse that actually sparked the flame (National Museum of Australia, 2020). This fire of origin from Kilmore finally blew its way across the freeway just before 2 p.m., and moved Southeast to encompass the remaining victim communities of the bushfires. Before 7 p.m., over 400 fires were inflamed (National Museum of Australia, 2020). Many of these fires even saw instances of flames soaring 20 to 30 meters high (National Museum of Australia, 2020). Directly or indirectly, 173 Australians lost their lives during this period, and over 2,000 homes were completely destroyed (AIDR, 2014). Human casualty and property loss were extremely widespread during this summer, but many wildlife experts in Australia estimated that wildlife loss was even more disastrous. Going off of basic assumptions and predictions, experts estimate that over a million individual animals may have died, as well. Some of these include organisms that reside within the boundaries of state, national, or wild sanctuaries, reserves, or parks (Encyclopedia Brittanica, 2009).
Image 2. This map displays an area of reference for where the occurrence of the 2009 Black Saturday bushfires took place (Encyclopedia Brittanica).
To battle the seemingly endless fires that scoured the state, the Australian government deployed over 19,000 County Fire Authority personnel in either incident control, or other various roles (AIDR, 2014). By the end of February, over $30 million was allocated by the Australian Government Disaster Recovery, including payments of $10,000 to bereaved families, $7,500 to the severely injured, and $5,000 to those who lost homes (AIDR, 2014). By April, Australia also received $379 million from a bushfire appeal fund established by the Victorian and Commonwealth Governments in collaboration with the Australian Red Cross (AIDR, 2014). The Insurance Council of Australia calculated the cost of damages in Victoria reached $1,070,000,000 by the end of 2009, but eventually creeped up higher all the way to $1,266,000,000 by the end of 2011 (AIDR, 2014). The state government issued the State Health Emergency Response Plan was activated at 8:00 a.m. on the morning of February 7th. This emergency response plan was set into place to plan, mitigate, pre-deploy essential resources, and utilize other agencies (Cameron, 2009). While the Australian government pleaded that they did everything in their power to prevent, mitigate, and recover, a Royal Commission assigned to investigate the governmental emergency response was savagely critical of Victoria's response agencies. The report indicated that warnings given out to at-risk communities were either severely inadequate or even non-existent. Warnings were failed to be issued by those responsible, communities were alerted and left their homes to only see fires at their front steps, poor decision making all led to the confusion and chaos that was the result (Stewart, 2009). This report also distinguished that of the 173 humans that lost their lives, 113 of them died in their homes that were deemed "undefendable from fire" (Stewart, 2009). If the preparation and response to the fires themselves went extremely poorly, so would be that of the recovery. Hospitals were completely unprepared and inept to handle the amount of burn patients or other victims during a period of declared heat/fire emergency by the Australian government. The Alfred Emergency and Trauma Center (E&TC), a major hospital in Victoria, had 3 emergency physicians, two advanced trainees in medicine, two hospital medical officers, and one intern on duty. There were also 17 nurses on staff, 8 of which being effectively trained in critical care and only 3 with expertise in burns and intensive care (Cameron, 2009). Overall, it is believed that the medical response to the bushfires were "acute" at best (Cameron, 2009).
Image 3. This image shows the results of a forest affected by the bushfires of 2009 in Victoria (BBC News).
Personally, it is seemingly simple and easy to see where the Australian government fell short on their emergency response. Officials responsible for notification of warnings were not good enough or able to do their jobs and were never held liable, the government as a whole acted extremely lacklusterly, and the hospitals that were closest to the events were incredibly unprepared to handle a natural disaster that is becoming ever so increasingly common in Australia.
Video 1. This video rolls footage of of remembrance of the Black Saturday bushfires, as well as firsthand accounts and reactions.
Sources:
Black Saturday bushfires. (2020, September 09). Retrieved November 28, 2020, from https://www.nma.gov.au/defining-moments/resources/black-saturday-bushfires
Black Saturday: The bushfire disaster that shook Australia. (2019, February 07). Retrieved November 30, 2020, from https://www.bbc.com/news/world-australia-47038202
Bushfire - Black Saturday, Victoria, 2009: Australian Disaster Resilience Knowledge Hub. (2014). Retrieved November 30, 2020, from https://knowledge.aidr.org.au/resources/bushfire-black- saturday-victoria-2009/
Cameron, P. (2009, July 06). Black Saturday: The immediate impact of the February 2009 bushfires in Victoria, Australia. Retrieved November 30, 2020, from https://www.mja.com.au/journal/2009/191/1/black-saturday-immediate-impact-february-2009- bushfires-victoria-australia
Stewart, C. (2009). The Australian "Black Saturday" Bushfires of 2009. Retrieved November 29, 2020, from https://www.britannica.com/explore/savingearth/the-australian-black-saturday-bushfires- of-2009
Victoria Remembers Black Saturday devestation. (2020). Retrieved November 29, 2020, from https://www.adelaidenow.com.au/news/national/victoria-remembers-black-saturday- devastation/video/7d2d89b4b075ffff6dcfebc22329bb31
During the summer of 2005 Hurricane Katrina hit the southeastern portion of the United States. The hurricane struck the Gulf of Mexico and caused extensive damages throughout Louisiana, and Mississippi. New Orleans was hit particularly hard by the weather event. The hurricane continued strong from August 23rd to August 31st.
A tropical depression formed over the Bahamas on August 23rd, 2005. When this storm was forming it was obvious that it would make landfall and citizens were already being evacuated on August 28th, 2005; but some predicted that the area would be “uninhabitable” after the damage (History.com, 2009). This depression would soon form into Hurricane Katrina and would make landfall on the morning of August 29th, 2005 (History.com, 2009). When the hurricane hit land on August 29th it was a category 4 on the Saffir-Simpson scale (History.com, 2009). Winds were as strong as 170 miles per hour (Encyclopedia Britannica, 2020). Much of Louisiana was affected by the storm but New Orleans, in particular, had acquired heavy amounts of damage. Thousands of people were displaced from their homes, and thousands more were not even able to go to a shelter (History.com, 2009). By the afternoon of August 29th, roughly 20 percent of the city was covered in water (Encyclopedia Britannica, 2020). The human environment for that area was destroyed, people were without basic necessities like food, water, and shelter some people resorted to looting in order to survive (Encyclopedia Britannica, 2020). The hurricane caused gas and chemical spills all over the area, which resulted in severe pollution and human illnesses brought on by the toxins in the water (Olson, 2005). The extreme weather also caused extensive damage to the coastal wetlands, causing erosion which washed away much of the soil (Palaseanu-Lovejoy, 2018).
Extreme weather cannot be controlled by humans, humans just have to live with the consequences of these weather events. Hurricane Katrina was not managed in a way that everyone was helped, thousands of people were homeless during a flood. Those of low socioeconomic status were greatly impacted by the hurricane because many people were unable to evacuate the area (History.com, 2009). The federal government was not prepared enough for the damage of this event; The Federal Emergency Management Agency (FEMA) took several days to set up an operation in New Orleans (History.com, 2009). Next time an extreme weather event happens, the federal government should plan for the worst, “planners have an obligation to take an active role and advocate for the funding and full participation necessary to achieve these goals” (Campanella, 2008). The flooding that occurred during the hurricane was because the levees were overwhelmed with the sheer amount of water. The New Orleans area would benefit from new levees and other forms of water management that would be inspected regularly for quality (Encyclopedia Britannica, 2020). Hurricane season happens every year, that is why it is important to find ways to take part in preventative measures such as strengthening barriers or even relocating homes and businesses. Many people lost their lives and their homes due to Hurricane Katrina but it is important to make sure it does not happen again.
Images:
This is a satellite image of Hurricane Katrina, the eye of the hurricane is clearly defined. The storm system is large and spans across the Gulf of Mexico. It shows how large the storm was, and why it did so much damage.
Serious flooding occurred from the hurricane, many people lost their homes and were displaced. It is important to remember the people that were personally affected by this natural disaster.
The levees flooded due to the hurricane and New Orleans suffered from severe flooding. Infrastructure precautions are an important step to keeping a population safe from the weather patterns of the region.
This video describes the reasons that New Orleans was struck so hard by hurricane Katrina. There are protections for the city that are manmade and natural, such as the wetlands. New Orleans is currently sinking because sediment is not able to wash up naturally onto land.
Sources:
Campanella, Thomas J. “Planning After Hurricane Katrina.” Taylor & Francis, 29 Jan. 2008, www.tandfonline.com/doi/abs/10.1080/01944360608976735.
Lopez, German. “Hurricane Katrina, in 7 Essential Facts.” Vox, Vox, 23 Aug. 2015, www.vox.com/2015/8/23/9191907/hurricane-katrina.
Olson, Erik D. “The Environmental Effects of Hurricane Katrina.” Nrdc.org, 6 Oct. 2005, www.nrdc.org/sites/default/files/leg_05100601A.pdf.
Palaseanu-Lovejoy, Monica. How Hurricanes Shape Wetlands in Southern Louisiana, 17 May 2018, ocean.si.edu/ecosystems/coasts-shallow-water/how-hurricanes-shape-wetlands-southern-louisiana.
The 2011 super outbreak began on April 25 and lasted until April 28 with the majority of tornadoes occurring from the 26 of that month to the 28th with the 27th being the most active and destructive day with 199 tornadoes recorded in that 24 hour period. These tornadoes occurred across the southern, central and eastern United States and affected the states of Mississippi, Alabama which fared the worst amongst all the states affected, Florida, Georgia, South and North Carolina, Tennessee, Arkansas, Missouri, Virginia, West Virginia, Maryland, Indiana, Ohio and New York. The outbreak began on April 25th when a strong cold front approached the Gulf of Mexico, where the dew points and moisture levels were high and the perfect amount of wind shear was present to give the perfect setup for supercell thunderstorms and tornadic activity. On April 25 the main storm activity was over Northeast Texas, Kentucky and Tennessee with the majority of the 69 recorded tornadoes being less than EF2 in intensity. The following day saw the similar set up over the same area with 50 tornadoes recorded over Eastern Texas to Western Kentucky. But the following day on April 27th was a recorded breaking day with over 199 tornadoes being recorded over that 24 hour period with some estimates being at 207 tornadoes. This day spawned deadly and destructive tornadoes across the entire south with the worst being in the state of Alabama where a EF4 tornado flatten towns and destroyed 10% of the residential area in Tuscaloosa, this particular storm tracked over 80 miles and was part of a thunderstorm cluster that had produced tornadoes over a 342 mile stretch from Mississippi to North Carolina. The Tuscaloosa was not the only strong tornado recorded that day but there was also 3 EF5, 12 EF4 and 21 EF3 tornadoes that struck throughout Mississippi, Tennessee, Georgia, Alabama, and Kentucky that afternoon into the evening. The day following the active day on the 27th we saw another 43 tornadoes reported from the residual system that spawned from Georgia to New York with 4 EF2 and one deadly EF3 twister that spun up with the rest being less EF1 or EF0. Over the course of the outbreak there were 300 tornadoes recorded across 15 states beating the previous record that was made during the 1974 Super Outbreak that spawned 148 tornadoes and killed 315 people.
EF4 Tornado damage over Tuscaloosa, Alabama following the tornado outbreak on April 27, 2011
Map of confirmed tornado touchdowns from April 26 to April 28, 2011
The month of April in 2011 was considered the most deadliest and destructive outbreak since records began in 1950 with about 90% of the supercells of the course of the April Super Outbreak producing at least one tornado with many being long tracked and intense. The outbreak had cost the United States 11-15 billion dollars in damage with just the debris cleanup in Tuscaloosa being around 100 million alone. The importance of this event is that even with the level of early warning that was provided by the National Weather Service Forecasting Offices there was still a high level of deaths at 315 people and 2900 injured showing the need for better awareness over these dangerous storms and education over what to do when there is a tornado watch or warning as this information is crucial in moments leading up to a severe weather event. This event destruction could not have been prevented as many of these storms went through suburban and urban centers causing 10 million cubic yards of debris as even with early warning systems and forecasting in place there was still widespread devastation and deaths. But one method to help prevent further events like this is to mitigate climate change as currently with the warming that has occurred there has been an uptick in the number of tornadoes with many researchers believe that climate change will increase the amount of tornadoes especially after the 2 degree warming point. But currently there is still disagreement on if global warming will contribute to more storms or not as the warm air from the gulf could cause the cold air from the Rockies to warm up causing less wind shear for the storms to form on, but at the same time extra moisture coming from the warming gulf could help intensify the contrast between the two air masses making storms more plausible. But one thing that all researchers are coming to agreement on is that climate change is causing tornadoes to shift their range as the dry 100 meridian moves eastward, and with this movement we are seeing tornadoes become more common eastward and northward into the southeast and great lakes regions.
Graphic showing in recent times tornadoes are increasingly occurring more east of the original tornado alley
This video explains the ingredients in place for this super outbreak to happen and how this is the second named super outbreak. The video also talked about records that were broken during the month of April in regards to Tornadoes and the timeline of these storms.
References:
Amadeo. K. (2020). Tornado Damage to the Economy. Thebalance. https://www.thebalance.com/tornado-damage-to-the-economy-3305667
Knupp, K. R. and Coauthors. (2014). Meteorological overview of the devasting 27 April 2011 Tornado Outbreak. Bull. Amer. Metero. Soc. 90, 1041-1067. https://doi.org/10.1175/BAMS-D-11-00229.1.
Rafferty. J. (2020). Super Outbreak of 2011. Encyclopaedia Britannica. https://www.britannica.com/event/super-outbreak-of-2011
Sosnowski, A. (2019). Remembering the deadly super tornado outbreak of 2011. Accuweather. https://www.accuweather.com/en/weather-news/remembering-the-deadly-super-tornado-outbreal-of-2011/331951
WeatherNation. (2019). April 27, 2011 super outbreak: 8 years later. WeatherNation. https://www.weathernationtv.com/news/2011-super-tornado-outbreak-look-back/
Eagle Creek Fire in the Columbia River Gorge (USA Today, 2020)
Sources:
Green, K. (2020, March 09). Story from Keep Oregon Green: 3 recent Oregon wildfires started by people. Retrieved November 10, 2020, from https://www.usatoday.com/story/sponsor-story/keep-oregon-green/2020/03/06/3-recent-wildfires-started-people/4967348002/
Cantrell, M. (n.d.). The Effects of Wildfires in the Western United States:
With Close Attention to Northern California and Southern Oregon. https://www.researchgate.net/profile/Mary_Cantrell4/publication/344359739_The_Effects_of_Wildfires_in_the_Western_United_States_With_Close_Attention_to_Northern_California_and_Southern_Oregon/links/5f6c087c299bf1b53eedc4be/The-Effects-of-Wildfires-in-the-Western-United-States-With-Close-Attention-to-Northern-California-and-Southern-Oregon.pdf
The 2019/20 Bushfire Season in Australia began in June 2019, and all fires were either contained or extinct by March 4, 2020 (Disaster Philanthropy, 2019). Although the bushfires burned across all six states, the areas most affected were New South Wales, Victoria, Queensland, and South Australia.
https://www.bnhcrc.com.au/hazardnotes/68
In the 2019/20 Bushfire season, more than 46 million acres (18,615,540 Hectares, 72,000 mi2) were burned, 34 human lives were lost directly related to the fires (CDP, 2019), and at least 445 human lives were lost indirectly (smoke inhalation), and put over 4,000 people in the hospital (Walhquist, 2020). Overall, the economic impact will far exceed the Black Saturday fires that cost USD $2.9 billion (CDP, 2019). Overall, the economic impact will far exceed the Black Saturday fires that cost USD $2.9 billion (CDP, 2019). Economist John Quiggin from the University of Queensland estimates USD 75,332,400 (A100 billion) of tangible costs as of January 6, 2020 (The Conversation, 2020). It is noted that the actual cost of this natural disaster will not be known for some time, as there are several weeks of fire season remaining (The Conversation, 2020). Of the total area burnt, 8.9 million hectares of native forest was burnt (Davey et al., 2020)
The Black Summer bushfires burned more area than any fire in New South Wales (NSW), with one of them being the largest forest fire in all of Australian history (Filkov et al., 2020). In Victoria, the season brought the highest number of fires, area burned, and second highest of houses burned this season. New South Wales had the highest number of area burned in the last 20 years, and South Australia had the highest number of homes lost during that season, as well as in the last 20 years (Filkov et al., 2020).
On record, 2019 was Australia’s warmest year (excluding parts of northwest Queensland and the northern tropics). Figure 1 shows the mean temperatures compared to historical observations (A) and mean temperature anomalies (B) (Filkov et al., 2020). January 2019 was Australia's warmest month. 2019 was also the driest year, with the amount of rainfall below 40% below the average for 1961-1990. In fact, for 70% of Australia, rainfall totals were in the lowest 10% of historical observations, with July 2019- December 2019 being among the ten driest for their month (Filkov et al., 2020). Figure 2 shows the rainfall deciles for (1990 to) 2019 (A) and annual mean rain (B), the black lines shows the moving average). The Indian Ocean Dipole (IOD) is the main contributor to the climate of Australia, and it was a strong positive in 2019, which contributed to the drought in Australia and low humidity (and intense flooding in Africa) (Filkov et al., 2020). The IOD disperses sea surface temperatures between Africa and Australia, so a positive IOD contributes to drought in Australia and floods in Africa, and the reverse when negative (Filkov et al., 2020). The combination of “a record of dryness, based on rainfall and evaporation, with meteorological variables for wind speed, temperature, and humidity” (Filkov et al., 2020) is used to measure the fire danger in the forests of Australia, called the Forest Fire Danger Index (FFDI). The FFDI, combined with high temperatures, caused an increase in fuel availability (Filkov et al., 2020). By spring, more than 95% had an FFDI above average, 60% of which were the highest on record for a particular area (Filkov et al., 2020). The states with record highs were New South Wales, Queensland, Northern Territory, Western Australia, and Tasmania (Filkov et al., 2020). Figure 3 shows the spring 2019 accumulation of FFDI in Australia (A), as well as the accumulated values from 1950 to 2019 (B); the black line is the linear trendline for the data (Filkov et al., 2020).
(Filkov et al., 2020)
I
would like to say that prescribed burns will mitigate this in the future, but climate
change and global warming may make them a futile attempt in some areas. The
Parliament of Australia has outlined several ways they mitigate catastrophic
fires including preventing fire ignition, reducing intensity by reducing fuel
load, improving measures taken to protect life and assets in built areas and
making communities more resilient to fire, and educating the public. In regards
to arson, it is rare for law enforcement to identify those responsible but if caught
the arsonist will face prosecution (Parliament of Australia). The Parliament of Australia also recognizes
that fire is a natural occurrence in Australia, therefore complete prevention
will not be possible.
Davey, S. M., A.
Sarre. 2020. Editorial: the 2019/20 Black Summer bushfires’. June 04.
Australian Forestry. Volume 83, 2020. Issue 2. https://www.tandfonline.com/doi/full/10.1080/00049158.2020.1769899
Filkov, Alexander
I., Tuan Ngo, Stuart Matthews, Simeon Telfer, Trent D. Penman. 2020. Impact
of Australia’s catastrophic 2019/20 bushfire season on communiites and
environment. Retrospective analysis and current trends. Journal of Safety
Science and Resilience, Volume 1, Issue 1. Pages 44-56. https://www.sciencedirect.com/science/article/pii/S2666449620300098
Parliament of
Australia. ND. Chapter 3—bushfire mitigation. Accessed 12/11/2020. https://www.aph.gov.au/Parliamentary_Business/Committees/Senate/Former_Committees/agric/completed_inquiries/2008-10/bushfires/report/c03
The Conversation.
2020. With costs approaching $100 billion, the fires are Australia’s costliest
natural disaster. January 16. Accessed 12/11/20
On April 15, 1935, the worst dust storm of the Dust Bowl, and that the country has ever seen, struck the United States. A cold front from Canada swept through the U.S. that morning, picking up loose soil along the way (Tarshis). The most hard-hit areas were the U.S. southern planes, including Texas, Oklahoma, and Kansas (Greenspan). Poor agricultural practices resulted in severe soil erosion, leaving thousands of acres of bare soil. This, plus the droughts of the thirties, proved to be the perfect conditions for a massive dust storm. The dust cloud was 1,000 miles long and blew at speeds up to 100 miles per hour (Blakemore). The first wall of dust hit Oklahoma around 4 p.m. and an even worse wave hit parts of Texas around 7:20 p.m. (National Weather Service).
The Black Sunday dust wall approaching Rolla, Kansas (Greenspan)
This day is referred to as "Black Sunday" because it seemed as if a mountain of darkness was sweeping over the planes. A sunny day was soon turned into a "horrible blackness that was darker than the darkest night" (National Weather Service). Drivers had to take refuge in their cars while other residents hid under beds and in storm shelters or fire stations (Greenspan). It's unclear if any deaths were specifically related to the dust storms on Black Sunday, but there were many injuries. 300,000 tons of dirt were dumped across 100 million acres of land. This destroyed wildlife and made agriculture impossible. Fields were leveled and many people went blind (Blakemore). What crops were left of the Dust Bowl withered and remaining cattle were wiped out by the storm. The land finally seemed impossible to revive, so many migrated to California after the Black Sunday storm.
Black Sunday, specifically, had many implications on current land use practices and government relief. This event turned soil conservation into a national priority. The storm's destructiveness forced the government to pay farmers to take marginal lands out of production (Greenspan). In 1936, Congress financed a program that would pay farmers to use new farming techniques, such as contour plowing, that would conserve topsoil and gradually restore the land. The Soil Conservation Service was established a year later, and "by the following year, soil loss had been reduced by 65%" even though the drought continued up until 1939 (West). This proves that human use of the land was the main contributing factor to the Black Sunday dust storm and the Dust Bowl as a whole. The knowledge we gained from these incidences have helped us to prevent another devastating dust storm in the southern planes.
Visibility of Garden City, Kansas 15 minutes after storm hits (National Weather Service).
Visibility of Garden City, Kansas minutes before the dust cloud arrived. (National Weather Service).
Footage from Black Sunday. (https://www.youtube.com/watch?v=7xfiwICl7SI)
Drought-plagued farmers in the Plains were overwhelmed when a massive dust storm hit on Sunday, April 14, 1935. This was nothing like previous dust storms of the Dust Bowl. Daylight turned to night in Oklahoma and Texas.
Sources
Blakemore, E. (2017, January 18). Black Sunday: The Storm That Gave Us the Dust Bowl. Retrieved December 11, 2020, from https://www.mentalfloss.com/article/63098/black-sunday-storm-gave-us-dust-bowl
Greenspan, J. (2015, April 14). What Happened on Black Sunday? Retrieved December 11, 2020, from https://www.history.com/news/remembering-black-sunday
Tarshis, L., & Brown, B. (2019). THE DAY THE SKY TURNED BLACK: In 1935, people of the Southern Plains suffered through one of the worst environmental disasters in U.S. history: Black Sunday, the biggest dust storm the country has ever seen. Junior Scholastic/Current Events, 9, 16.
US Department of Commerce, N. (2017, April 14). The Black Sunday Dust Storm of April 14, 1935. Retrieved December 11, 2020, from https://www.weather.gov/oun/events-19350414
West, L. (n.d.). The Dust Bowl: The Worst Environmental Disaster in the United States. Retrieved December 11, 2020, from https://www.thoughtco.com/worst-us-environmental-disasters-1203696
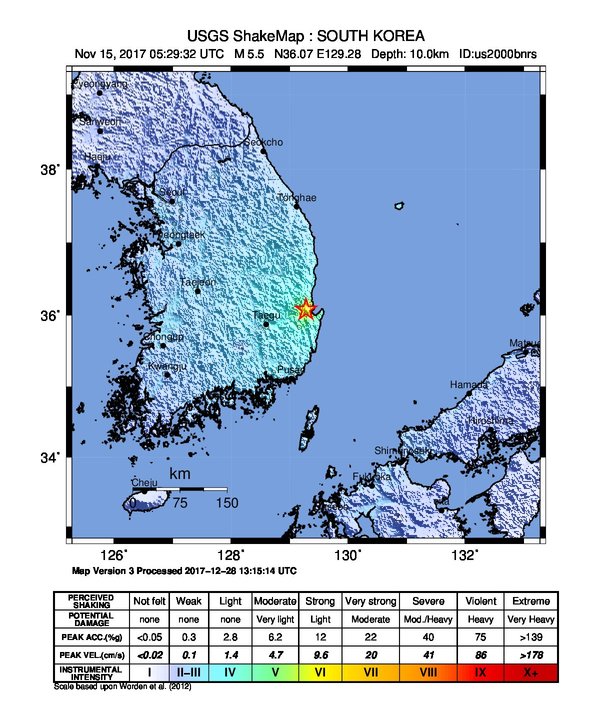
U. (2017, December 28). USGS ShakeMap: South Korea [Digital image]. Retrieved October 22, 2020, from https://commons.wikimedia.org/wiki/Category:2017_Pohang_Earthquake#/media/File:2017_Pohang_earthquake_intensity_map.jpg
When talking about earthquakes we rarely ever think about countries such as South Korea. To be fair South Korea also rarely have earthquakes. in the past 365 days, only 3 has accord. However, power is not to be underestimated. This year alone South Korea has seen earthquakes with magnitudes of 6.3 that's very significant. But today we're going to talk about the 2017 Pohang earthquake.
E. (2017, 15, November). [Wall crumbles onto car]. Retrieved October 22, 2020, from https://www.scmp.com/news/asia/east-asia/article/2120157/rare-quake-south-korea-left-1500-homeless-dozens-injured-and
November 15, 2017, it was just like any other day in the southeast city of Pohang. A city of about 516,000 residents. Until the 5.5 magnitude earthquake struck. It struck the city with enough force to crumble walls, crack roads, and collapse old buildings. causing over 90 people to have injuries and causing over $52 million in economic damages. Not only were man-made structures damaged but so was the land. Fissures were open due to this high magnitude earthquake. At the time it was the 2nd strongest earthquake South Korea has experience after starting to monitor them in 1978. The state-run Korea Meteorological Administration said the epicenter was inside Pohang while the US Geological Survey said it was centered about 9.3 kilometers northwest of the port city. This conflicting information is actually very important to this story. The people of Pohang actually sued the state due to this earthquake being quote "mad made". People were lead to believe the earthquake was caused in part due to the influence of the local industrial activities the state was taking in part in. In the area, the government was using high-pressure hydraulic injection for the past 2 years for a geothermal power generator. Which is known to raise the possibility of an earthquake. The location that was chosen is a very enhanced geothermal system site, so it's very highly that the earthquake was in part anthropogenic in nature. Without a doubt this highly impactful event could have been mitigated by the government it chose not to set up a geothermal plant, instead, it did. But the fact doesn't change how they reacted afterward. South Korea is a very efficient country when it comes to helping its people in a crisis. Due to building codes and public knowledge people were at a lower vulnerability than say Haiti.
[Digital image]. (n.d.). Retrieved October 22, 2020, from https://www.gettyimages.com/photos/south-korea-posco-steel-plant?mediatype=photography&phrase=south%20korea%20posco%20steel%20plant&sort=mostpopular
This video shows the perspective of everyday residents. Damages are extensive and costly to not only buildings and structures thought this city but everyday Koreans. about 1,500 people were left homeless. Luckily no deaths were reported.
The Diplomat [Digital image]. (2017, November 18). Retrieved October 22, 2020, from https://thediplomat.com/2019/12/the-social-fallout-from-pohangs-man-made-earthquake/
In the end, this earthquake could have been very dangerous if the country wasn't as modern as it is today. I still believe the country needs to take more steps into protecting its people's best interest and also its economic ones. Yet I feel as if they knew what would happen. The science indicates that making geothermal generators on seismically active areas will indirectly cause earthquakes. The government found that out the hard way.
Citation
Grigoli, F., Cesca, S., Rinaldi, A., Manconi, A., López-Comino, J., Clinton, J., . . . Wiemer, S. (2018, June 01). The November 2017 Mw 5.5 Pohang earthquake: A possible case of induced seismicity in South Korea. Retrieved October 23, 2020, from https://science.sciencemag.org/content/360/6392/1003.full
Paul VoosenApr. 26, 2., Peter Behr, E., Lindzi Wessel, R., Pratik PawarOct. 20, 2., Scott Waldman, E., Rebekah Tuchscherer, R., . . . Rasha AridiSep. 23, 2. (2018, April 30). Second-largest earthquake in modern South Korean history tied to geothermal plant. Retrieved October 23, 2020, from https://www.sciencemag.org/news/2018/04/second-largest-earthquake-modern-south-korean-history-tied-geothermal-plant
Recent Earthquakes Near South Korea. (n.d.). Retrieved October 23, 2020, from https://earthquaketrack.com/p/south-korea/recent
Yesterday's earthquake in South Korea was the second-strongest the country has ever been hit by. (2017, November 16). Retrieved October 23, 2020, from https://www.independent.co.uk/news/world/asia/south-korea-earthquake-latest-pohang-quake-second-strongest-record-5-4-magnitude-a8057946.html
Staff, S. (2019, March 20). Geothermal plant 'triggered earthquake' in S. Korea. Retrieved October 23, 2020, from https://phys.org/news/2019-03-geothermal-triggered-earthquake-korea.html
On March 11, 2011, at 2:46 pm Eastern Standard Time, the largest recorded earthquake to ever hit Japan occurred 231 miles northeast of Tokyo, in the region of Tohoku. Originally recorded at an 8.9, the magnitude was later upgraded to a 9.1 (CNN, 2020). About an hour later, at approximately 4:00 pm, a tsunami generated in the Pacific Ocean overtook the coast of Japan, killing over 15,800 people, and leaving almost 3,000 unaccounted for (NOAA, 2011. CNN, 2020). The aftermath of the catastrophe is ongoing as of 2020.
The earthquake that generated the tsunami which resulted in the death of thousands of people in Tohoku, Japan, was a result of thrust faulting on or near the subduction zone interface plate boundary between the Pacific and North America plates (NOAA, 2011). According to the National Oceanic and Atmospheric Association (NOAA), the location and depth are consistent with the action of the Pacific Plate thrusting under the Japan Trench, located beneath Japan (NOAA, 2011). This subduction of the Pacific Plate was the source of the massive 9.1 magnitude earthquake which would ultimately result in the catastrophic tsunami.
People began feeling the large foreshocks on March 9th, two days prior to the 9.1 M earthquake which occurred on March 11th. The largest foreshock felt on March 9th was a 7.8 M about forty kilometers from where the March 11th earthquake took place (NOAA, 2011). About an hour after the 9.1 M earthquake hit, a tsunami with waves reaching up to 130 feet enveloped the Tohoku region of Japan, taking out everything in its path for over 2000 kilometers (Mori et al. 2011). According to witnesses, shortly after the waves had subsided, it began to snow, which was interpreted by survivors as a cruel sign that nature shows no mercy (Meurer, 2020).
The majority of death and destruction which occurred as a result of this combination of natural disasters were ultimately caused by the tsunami, rather than the earthquake. As of 2015, there were 15,890 confirmed deaths, 2,590 missing, and 6,152 injuries as a result of the tsunami (NOAA, 2011). Further, the tsunami resulted in the loss of homes for 450,000 individuals, destroyed thousands of businesses, and devastated the Japanese infrastructure (National Geographic Society, 2020). The tsunami was also the direct cause of an event known as the Fukushima Nuclear Disaster, which consisted of the meltdown of three nuclear reactors at the Fukushima Daiichi Nuclear Power Plant, wherein toxic, radioactive materials were released into the environment, forcing thousands to evacuate their homes and businesses immediately (National Geographic Society, 2020). This event alone will have ecological impacts for decades, if not centuries.
In fact, several of the residual effects of this catastrophe will likely take lifetimes to
overcome. Virtually all infrastructural, economic, and biological resources that existed in Tohoku, Japan before March 11th, 2011 were demolished that day, leaving survivors no choice but to either leave permanently or to come back and start over from scratch. The roads, plumbing, and electrical systems which had been the basis of the region’s society were not only no longer functional, but no longer existed. The economic destruction imposed upon the community was devastating based on the amount of damage alone, but when the loss of businesses and assets which took place on such a massive scale is also taken into consideration, the severity of the situation starts to set in. The damage caused to the local environment was insurmountable, and continues to have implications for remote locations as well. The Japanese government estimates that the tsunami swept about five million tons of debris offshore, and that 70% sank, leaving 1.5 million tons of debris floating in the Pacific Ocean (CNN, 2020). With the percentage of plastics and other pollutants in the Pacific already increasing at a rapid rate and breaking down to nanoparticles which can thereby be consumed by aquatic organisms, eventually working their way up trophic levels and reaching the top consumers, humans, this could potentially contribute to adverse health effects in species all across the globe for years to come.
Tsunami waves overtopping seawalls in Iwate Prefecture, Japan (Taylor, 2016).
Cars and airplanes swept by a tsunami sit among debris at Sendai Airport (Taylor, 2016).
Houses burn at night following the tsunami in Natori City (Taylor, 2016).
2011 Japan Earthquake - Tsunami Fast Facts. (2020, June 02). Retrieved October 23, 2020, from https://www.cnn.com/2013/07/17/world/asia/japan-earthquake---tsunami-fast-facts/index.html
Mori, N., Takahashi, T., Yasuda, T., & Yanagisawa, H. (2011). Survey of 2011 Tohoku earthquake tsunami inundation and run-up. Geophysical Research Letters,38(7). doi:10.1029/2011gl049210
National Geographic Society. (2014, May 16). Tohoku Earthquake and Tsunami. Retrieved October 23, 2020, from https://www.nationalgeographic.org/thisday/mar11/tohoku-earthquake-and-tsunami/
Taylor, A. (2016, March 10). 5 Years Since the 2011 Great East Japan Earthquake. Retrieved October 23, 2020, from https://www.theatlantic.com/photo/2016/03/5-years-since-the-2011-great-east-japan-earthquake/473211/
United States, National Oceanic and Atmospheric Administration, National Geophysical Data Center. (n.d.). MARCH 11, 2011 JAPAN EARTHQUAKE AND TSUNAMI.


