Featured Post

Welcome to the Blog

Welcome to our Natural Disasters Blog!  Below you will post your disaster summaries as you complete them. Remember to initiate a post with t...

Tuesday, November 5, 2024

Chile's Villarrica: Ongoing Eruptions and the Major Event of 2015

 Unlike many other active volcanoes that are distributed around the world, Chile’s Villarrica–located along the nation’s Southern Andes–periodically sputters with a mixture of ash and volcanic gasses without erupting entirely. At 2,840m tall, the volcano has historically been a popular spot for hikers, geologists, and volcanologists seeking both recreation and research at the summit. In particular, Villarrica offers the unique experience of being able to gaze down into the crater and view a lake of lava that is active but only intermittently so; even despite the threat that the volcano poses in its fairly frequent activity, both tourists and residents alike have not shied away from this unique apex of seismic activity.


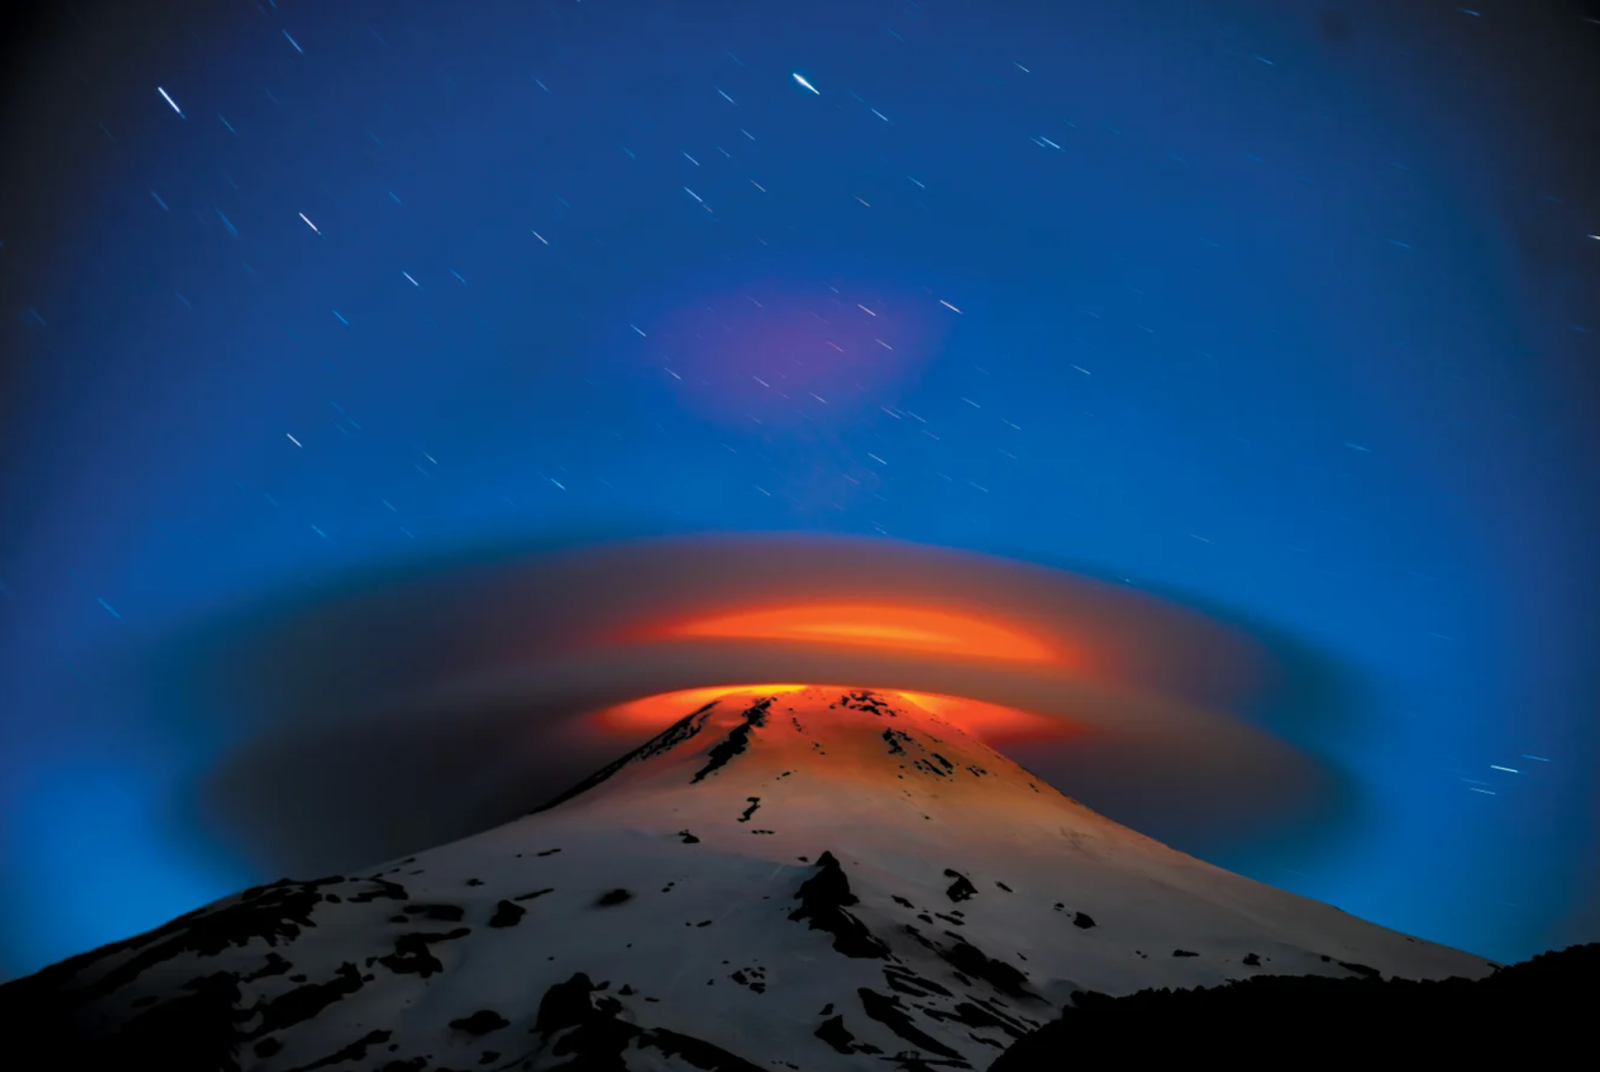
Rucapillàn, as the locals call it, or, “House of the Spirits,” photographed from the base of the volcano. Its volcanic gasses that are periodically emitted into the atmosphere along with the ash that is spewed during both large and minor eruptions create this otherworldly effect, thereby earning the name that the locals gave it. Courtesy of Joanna Thompson.


But in 2015, the regularity of recreation in this area ceased to exist when a major eruption (in terms of this particular volcano) occurred. At around 3:00 AM local time on March 3, 2015, Villarrica erupted, spewing both ash and lava of a mixed composition into the sky. The ash was estimated to have been spewed up to 3,000 meters high, with a more vague reporting of the extent to which the lava reached. 


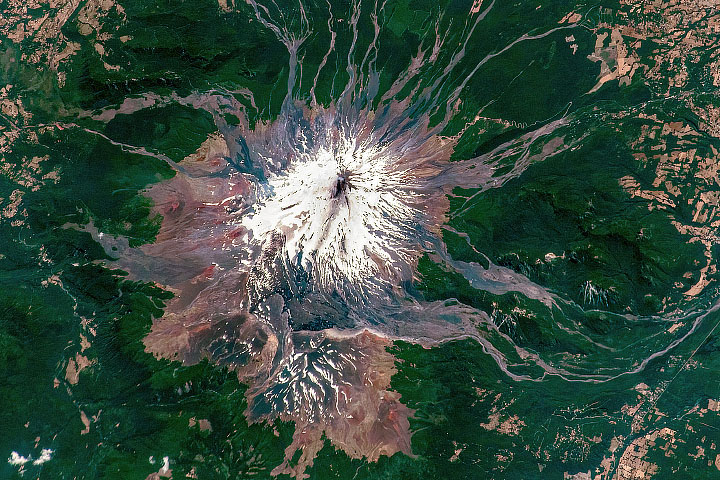
An image of Villarrica’s minor explosions captured from the International Space Station, 2023. This demonstrates the consistent sputtering and small eruptions that are characteristic of Villarrica. Courtesy of NASA Earth Observatory.


Both rainfall and melted snow and/or glacier ice mixing with the eruption’s flow caused massive lahars in the area, which are defined as mud and debris flow, and were present during two other major eruptions in the volcano’s history, taking place in 1964 and 1971. Because of the risk that these lahars posed to the surrounding area, residents within a 10km radius were instructed beforehand to evacuate to safer areas until the at-risk radius was confirmed safe. The largest city nearby, Santiago, was not intensely impacted by the eruptions of March 3, 2015, but local authorities did issue an Orange Alert for the residents of that city, which is the second-highest level of alert on a four-tier scale; according to USGS, this level means that a major eruption is either imminent or underway, but poses limited risk to surrounding aviation, as an eruption of this class would most likely only produce substantial lava flows. The alerts on this scale are based on seismic activity, ash emissions, gas and steam emissions, and ejections of incandescent material. 

In terms of impact, this eruption had minimal casualties, with no sources reporting deaths or injury to residents in the area; due to the ample warning time on part of Sernageomin, Chile’s National Geology and Mining Service, residents within the blast radius were able to evacuate in time and avoid the worst of the event. The ample warning time could be attributed to the minor blasts and sputters that the volcano produced in the days prior to the event, and seismic activity monitoring in the area allowed officials to properly spread the word of the impending eruption. Local communities were primarily threatened by ash, lava, floods, and mudslides as snow and glacial cap melted off the mountain in the wake of the heat released by the eruption. Residents of these areas were safe, but were instructed to use extreme caution and leave the area until the worst of the eruption had ceased. The greatest impact was felt by the infrastructure of the surrounding towns and waterways, as rising rivers following the lahars and lava flows caused bridges and surrounding architecture to be destroyed.


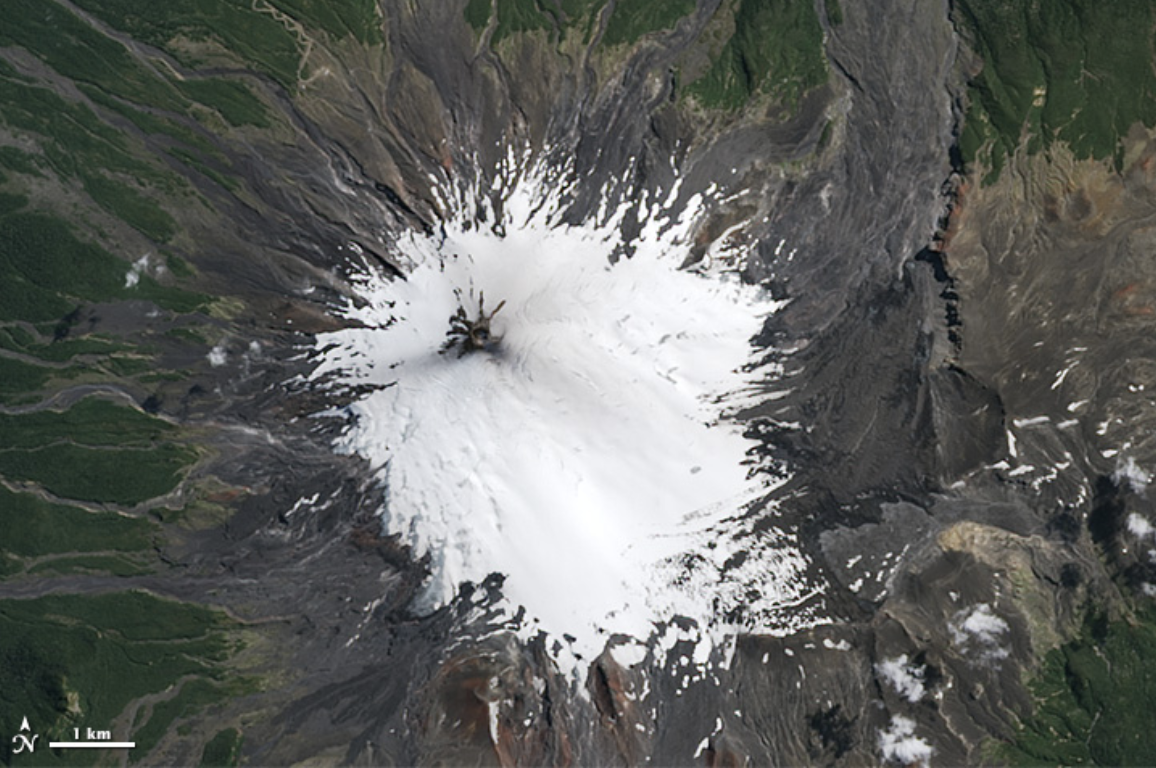
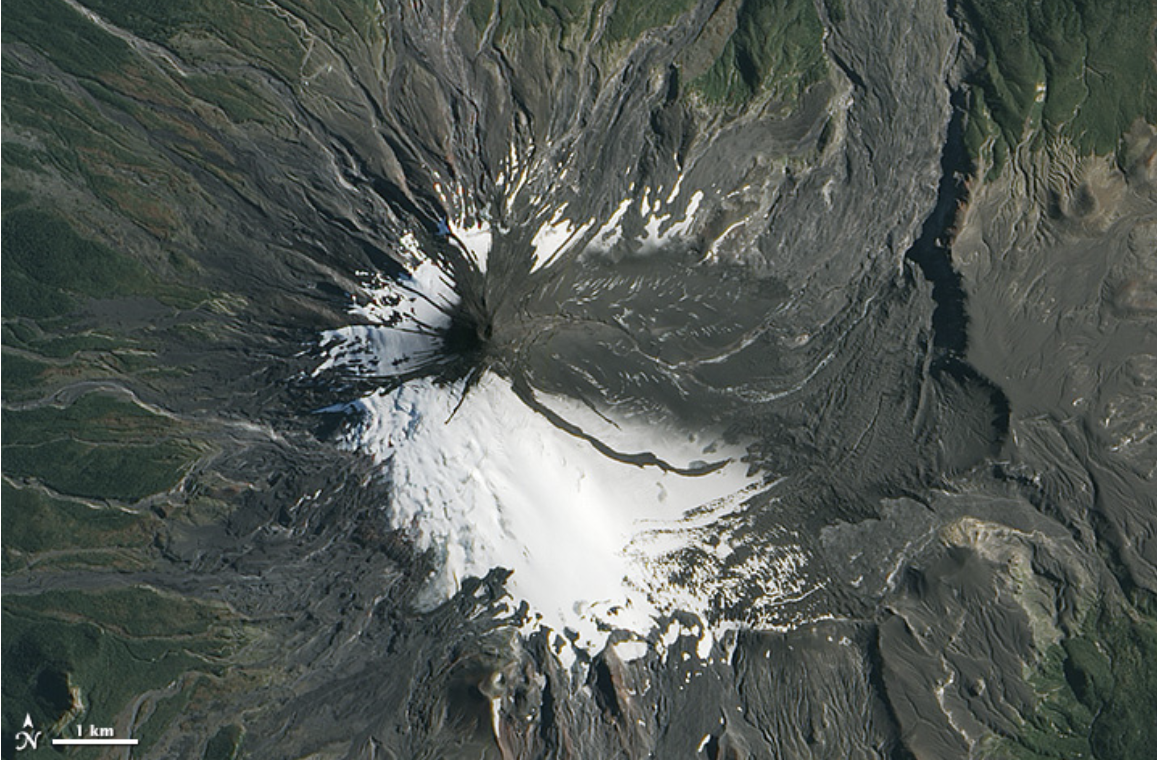
Left: February 22, 2015. Right: March 5, 2015.

Ice and snow content atop the mountain before and after the March 3 eruption, demonstrating the effect that the lava flow had on snow and glacial cap.


Villarrica is a stratovolcano containing lava composed of a basaltic-andesitic composition; its slopes were formed by cooling lava flows from past eruptions. It is one of the most active and dangerous volcanoes in Chile, and is one of more than 2,000 volcanoes located in the Andes cordillera; about 90 of those 2,000 remain classified as ‘active.’ Villarrica in particular is the westernmost of three stratovolcanoes in the area, which trend perpendicular to the Andean chain along the Gastre Fault, the source of seismic activity in the area. 

In terms of damage caused by this eruption, this explosion was minimal. Human casualties remained unreported in all sources, indicating that the ample warning time provided by officials was substantial enough to allow for safe passage out of the area for all residents. While there is a possibility of undocumented casualties, it is highly unlikely. The greatest loss following this disaster had much more to do with infrastructure, as buildings and architecture in the path of the lava flows and rising water levels due to the eruption were destroyed and in need of reconstruction in the following months. 

Officials monitoring this seismic zone were proactive in terms of this eruption, and remain so in the years since. Sernageomin keeps four webcams on the volcano active at all times, allowing for constant surveillance of the area and thus maintaining a ready warning system should the need arise. 

Because this volcano consistently exhibits ongoing sputtering eruptions, Sernageomin continues to monitor and adjust warnings and procedures for local residents of the area, healthily maintaining a watch on the volcano and its potential hazards. 


Spectacular Eruption of Chile’s Villarrica Volcano; Thousands Evacuated

A brief news clip speaking on the day of the event. Thousands of local residents were instructed to evacuate from the area due to the risks posed by the impending eruption.


Massive volcano eruption: Chile’s Volcano Villarrica spews lava and ash 1,000 meters into the air

Another brief news clip speaking on the eruption. A brief explanation on the type of volcano, how it was formed, and its composition was included. Further, the video explained some of the causes for the explosivity of this particular volcano. 


Works Cited

“Alert Level Icons.” Alert Level Icons | U.S. Geological Survey,
www.usgs.gov/programs/VHP/alert-level-icons#:~:text=WARNING%20/%20ORANGE,
no%20risk%20of%20ash%20production). Accessed 5 Nov. 2024.

“Chile’s Villarrica Sputters.” NASA, NASA, earthobservatory.nasa.gov/images/150898/chiles-villarrica-sputters.
Accessed 5 Nov. 2024.

“Eruption of Villarrica Volcano.” NASA, NASA, earthobservatory.nasa.gov/images/85465/eruption-of-
villarrica-volcano. Accessed 5 Nov. 2024.

Stone, Luke. “Villarrica Volcano Activity Increases, Alert Level Raised to Orange.” OpenSnow, 1 Oct. 2023,
opensnow.com/news/post/villarrica-volcano-activity-increases-alert-level-raised-to-orange.

Thompson, Joanna. “Lava-Lit Lenticular Cloud Crowns Volcano in Spectacular Photo.” Scientific American,
Scientific American, 29 July 2024, www.scientificamerican.com/article/lava-lit-lenticular-
cloud-crowns-volcano-in-spectacular-photo/#:~:text=
Villarrica%20is%20one%20of%20Chile’s,Villarrica’s%20crater%E
2%80%94it’s%20a%20cloud.

“Villarrica Volcano Eruption.” Rice Northwest Museum of Rocks & Minerals, 5 Mar. 2015,
ricenorthwestmuseum.org/2015/03/05/villarrica-volcano-eruption/. 


Monday, November 4, 2024

Mount Pinatubo Eruption - 1991


 Mount Pinatubo eruption - 1991

    Mount Pinatubo is a volcano located in the Philippines around 55 miles northwest of Manila which had remained dormant for around 600 years. Earthquakes and steam eruptions began as early as April 2nd started as a waring towards the upcoming eruption of the Pinatubo stratovolcano. Very few, if any, danger maps were available at the time, so volcanologists were quick to start developing a danger map specifically by the PHIVOLCS-VDAP team to give a rough estimate of the people most in danger of a potential eruption. This map, though quickly made, was generally accurate to the areas that would be the most drastically impacted by the upcoming eruption. Along with this, plans were made to evacuate the surrounding area and to bring people to a safe place. On June sixth, the volcano began to swell and give off small ash eruptions, signaling a full eruption and on June 12th, the first eruption occurred sending a 12 mile ash cloud into the air and beginning evacuations. An even larger eruption occurred on June 15th depositing 660 feet of volcanic deposits. This was paired with typhoon Yunya which spread ashfall far further than was expected, including Manila and Subic Bay as well as destroying the roofs of houses that would be otherwise safe from the ash. This eruption destroyed buildings, cars, and bridges within 18 miles of the volcano and many towns were buried in mud. This ended with a death tally of 840 (communications and publishing, 2016) and 100,000 homeless (Matthias, Meg, 2024).

    This event was a tragedy, simply put. While there is a lesson to learn, as there should have been a system placed already in preparation of an eruption event, that is if they even knew it was active at that point. But even then, when signs of an eruption showed, they were quick to rectify this inaction and set up a plan with little to no hesitation. This plan would have been very effective as well if it weren't for the typhoon that struck at the same time which caused far more destruction and death than if the eruption were to have occurred alone. Even if the more advanced communication technology were available to those in charge at the time, that would only have marginally helped the death count as the factor of the typhoon would still likely not be accounted for. That typhoon was a factor that no one was prepared for and had no real reason to prepare for, as it is such an unlikely event that it wouldn't warrant preparation. Alongside this, a disease in the evacuation camps caused even more death (Matthias, Meg, 2024) to what should have been a very prepared safety system. The eruption alone was devastatingly large, the second largest of the 20th century (Allen, Timothy "Seph", 2021), but combined with the typhoon and disease, created a setting that wasn't possible to prepare for.


Accuweather, Brian Lada, 2021. https://www.accuweather.com/en/weather-news/mount-pinatubo-eruption-june-1991-30-year-anniversary/962916 [ID a massive ash cloud towering above a field]. This image was chosen to show the immense scale of the eruption.


Vintag, unknown author, 2020. https://www.vintag.es/2020/06/mount-pinatubo-eruption.html [ID people looking at rubble of what used to be a house]. This image was chosen to show the amount of damage caused by the eruption.


Wired, Erik Klemetti, 2011. https://www.wired.com/2011/06/the-20th-anniversary-of-the-eruption-of-pinatubo-in-the-philippines/ [ID a map showing the areas affected by Pinatubo's lahars]. This image was chosen to show the size of the eruption in detail.

https://www.youtube.com/watch?v=Nk_SujzwjV0 The first half of this video is about the sheer size and power of the Pinatubo eruption. And the second half is about what can be done in preparation for an eruption of this magnitude in the future,

Brittanica, (last updated 2024, September 21), Mount Pinatubo, revised and updated by Meg Matthias, retrieved November 2nd 2024 from https://www.britannica.com/place/Mount-Pinatubo

USGS, (2016, June 16th), Remembering Mount Pinatubo 25 years ago, by communications and publishing, retrieved November 2nd 2024 from https://www.usgs.gov/news/featured-story/remembering-mount-pinatubo-25-years-ago-mitigating-a-crisis

Nasa, (2021, June 15th), Remembering Mt. Pinatubo, by Timothy "Seph" Allen, retrieved November 2nd 2024 from https://appliedsciences.nasa.gov/our-impact/story/remembering-mt-pinatubo  

LiveScience, (2011, June 15th), Pinatubo: Why the Biggest Volcanic Eruption Wasn't the Deadliest, by Stephanie Pappas, retrieved November 2nd 2024 from https://www.livescience.com/14603-pinatubo-eruption-20-anniversary.html

Earth: The Science Behind the Headlines, (2018, May 1st), Benchmarks: June 15th, 1991: Mount Pinatubo erupts, by Lucas Joel, retrieved November 2nd 2024 from https://www.earthmagazine.org/article/benchmarks-june-15-1991-mount-pinatubo-erupts


Sunday, November 3, 2024

Hurricane Milton

 Hurricane Milton: October 9, 2024


Figure 1. Damage from Hurricane Milton in St. Petersburg Florida showing the roof of Tropicana Field torn off (Schilken 2024). 


Hurricane Milton struck the western coast of the Florida panhandle in the late hours of October 9, 2024. The storm system caused flash flooding, storm surges over 8 feet, and 46 tornadoes, the most ever in Florida in over 70 years (Belles et al 2024). Some of the most affected areas were St. Petersburg, Fort Myers, Sarasota, and Tampa Bay (Ahmedzade et al 2024).


Figure 2. NWS Map showing path and size of Hurricane Milton from the first advisory on October 5, 2024 through the last advisory on October 10, 2024 (National Hurricane Center 2024).


    Hurricane Milton was first identified as a tropical storm in the Gulf of Mexico on October 5, 2024 and developed into a hurricane on October 6. This storm quickly developed into a Category 5 hurricane by October 8. Fortunately by the time it made landfall on October 9, Hurricane Milton weakened back to a Category 3 hurricane (Belles et al 2024). The storm system claimed the lives of at least 14 people (Lamb 2024). 

    There were several key components of the storm system that caused damages. One component was the tornado outbreak. A total of 46 tornadoes were manifested as a result of Hurricane Milton moving through Florida. The deadliest tornado was an EF3 tornado that touched down in St. Luice, Florida and claimed the lives of six people (Belles et al 2024). Rains from Hurricane Milton caused flash floods. Areas east of Tampa received as much as two feet of rain between October 9 and 10 as a result of the hurricane. Tampa Bay received 11 inches of rain in just one day, breaking a 100 year record (Belles et al 2024). Winds reached speeds over over 100 mph on the Florida coast. Planes were flipped, a crane was toppled, and the top of Tropicana Field was even ripped off due to the high speed winds (Fig. 1). 

    Hurricane Milton caused an estimated $50 billion in damages (Lamb 2024). One global insurer estimated that it lost an estimated $300 million from insurance claims put in due to storm damages. Hurricane Milton could potentially have lasting effects on Florida's ecosystem. One such example is a wastewater treatment plant in Leesburg, Florida. Flooding from Hurricane Milton caused a backup generator to not work, and 2 million gallons of untreated wastewater spilled into Leesburg’s streets as a result. This water could contain fecal coliforms and bacteria like E. coli, and could have negative impacts on the surrounding environment or seep into private water wells (Price 2024). 


Figure 3. Map of Total Rainfall across Florida due to Hurricane Milton (Belles et al 2024).


While the impacts of Hurricane Milton on Florida were great, data suggests that greater losses were prevented as a result of evacuation mandates and warning systems. Cell phone data showed that areas around the west coast of Florida where the hurricane made landfall had evacuation rates of 80 to 90 percent (Lamb 2024). This evidence shows that storm alerts can be effective in getting people directly out of harm's way. The alerts were effective at moving people off the coasts, but evacuation rates further inland were between 45 and 50 percent (Lamb 2024). Reasons for this drop in evacuation were unclear, but it was mentioned that people with pets and senior residents were less likely to evacuate (Lamb 2024). Responding to the evacuation orders maybe could have prevented some of the deaths from occurring.

In preparing for Hurricane Milton, many gas stations in Florida ran out of gas. It was reported on October 9, 2024, just hours before the storm hit, that nearly one in four gas stations had run out of fuel (Isidore and Egan 2024). The gas shortage not only came from people trying to fuel up before they evacuate, but also people who planned on staying, filling up gas tanks to power generators (Isidore and Egan 2024). The shortage was even worse in places like Tampa, where nearly two thirds of gas stations were without fuel (Isidore and Egan 2024). This is just one example of an unforeseen impact that can come as a result of a natural disaster. Mitigation of unforeseen natural disaster impacts is tough. Gas could have been rationed out potentially in order to better control gas amounts in the area. 

One more important aspect of Hurricane Milton is that this hurricane is a perfect example of how climate change is causing more frequent and potent natural disasters. Scientists found that anthropogenic climate change caused Hurricane Milton to produce 20-30% more rainfall and 10% stronger winds (St. John 2024). The surge in storm strength was driven by warmer waters in the Gulf of Mexico, 1 degree Celsius warmer than the 1991-2020 average (St. John 2024). Another study suggested that in the absence of human induced climate change, Hurricane Milton would have made landfall as a Category 2 Hurricane as opposed to a Category 3 Hurricane (St. John 2024).


Figure 4. Graph comparing wind speeds of Hurricane Milton and Hurricane Wilma shortly before making landfall in Florida. Note how soon Hurricane Milton peaked, only 50 hours before making landfall (St. John 2024).


Video 1. News Broadcast from NBC showing the extent of the damage from the storm system. Includes flood damage, tornado damage, wind damage, and even fires that resulted from blown transformers.


References


Ahmedzade, T., Swan, L., & Betts, A. October 2024. A Visual Guide to the Damage Caused by Hurricane Milton. Accessed November 3, 2024. https://www.theguardian.com/us-news/2024/oct/10/hurricane-milton-maps-charts-graphics-damage#:~:text=For%20about%20eight%20hours%2C%20the,cities%20on%20the%20Gulf%20coast.

Belles, J., Dolce, C., Kaiser, C., & Tonks, S. October 2024. Hurricane Milton Brought Devastation Across Central Florida. Accessed November 3, 2024. https://weather.com/storms/hurricane/news/2024-10-09-hurricane-milton-forecast-landfall-florida-storm-surge-wind

Gangcuangco, Terry. November 2024. Chubb Estimates Losses from Hurricane Milton. Accessed November 3, 2024. https://www.insurancebusinessmag.com/us/news/catastrophe/chubb-estimates-losses-from-hurricane-milton-512398.aspx 

Isidore, C. & Egan, M. October 2024.Nearly 2,000 Florida gas stations have run out of fuel,  Hurricane Milton could cause even more trouble. Accessed November 3, 2024. https://www.cnn.com/2024/10/08/business/hurricane-milton-florida-gasoline-shortages/index.html

Lamb, Anna. October 2024. Amid Hurricane Milton’s Devastation, a Sliver of Good News. Accessed November 3, 2024. https://news.harvard.edu/gazette/story/2024/10/amid-hurricane-miltons-devastation-a-sliver-of-good-news/

National Hurricane Center. October 2024. Post-Tropical Cyclone Milton. Accessed November 3, 2024.  https://www.nhc.noaa.gov/refresh/graphics_at4+shtml/203803.shtml?swath#contents

Price, Kiley. October 2024. After Hurricanes Helene and Milton, Bacteria and Chemicals May Lurk in Flood Waters. Accessed November 3, 2024. https://insideclimatenews.org/news/11102024/todays-climate-hurricane-milton-chemicals-sewage-floods/ 

Schilken, C. October 2024. Hurricane Milton rips off Ray's Tropicana Roof that was built to withstand 115-mph winds. Accessed November 3, 2024. https://www.latimes.com/sports/story/2024-10-10/hurricane-milton-tropicana-field-raymond-james-stadium 

St. John, A. October 2024. Climate change gave significant boost to Milton’s destructive rain, winds, scientists say. Accessed November 3, 2024. https://apnews.com/article/hurricane-milton-climate-change-greenhouse-gases-fossil-fuels-aa1c971c228feb9da6f36fb9cc46ee81


Thursday, October 31, 2024

Hurricane Sandy

  Hurricane Sandy took place on October 29, 2012. Sandy formed in the Caribbean on October 22nd and made its way to Jamaica, Eastern Cuba, and the Bahamas. On the 28th, the hurricane made its way to the Atlantic coast on the 28th and Sandy later transitioned into a post-tropical cyclone before hitting Atlantic City, New Jersey. The hurricane was a category 1 hurricane when it hit Jamaica, a category 3 when it hit Cuba, and the hurricane went back to a category 1 when it hit Jamaica. The hurricane weakened once it hit near Brigantine, New Jersey (Blake et al, 2012). The storm hit areas of New Jersey and New York coastlines. When Sandy made landfall, it had 80 mph winds and a record breaking storm surge (Department of Environmental Protection). It resulted in flooded streets, toppled power lines, and houses that swept off their foundations. Hurricane Sandy was a late in the season hurricane that varied in intensity as it traveled over different parts of the World. Hurricane Sandy was an extremely large hurricane, and it grew in size significantly from the time it reached the Bahamas to its landfall along the mid-Atlantic coast. The change in environment as it moved from the Bahamas to the mid-Atlantic coast resulted in the hurricane becoming a tropical storm that weakened in intensity over time.          

There were around 147 deaths from the Hurricane, and 72 fatalities. This is the most fatalities directly related to a tropical cyclone, not including the southern states, since 1972 (National Hurricane Center, 2013). The aftershocks that came from the hurricane along with the hurricane itself were hard to recover from. Hurricane Sandy came at a bad time because the hurricane hit New Jersey during high tide, which led to higher water levels, eroded dunes, and water rushing through streets (Bowman, 2012). This destruction led to extreme damages to houses built close to the beach. Many infrastructures right on the beach were severely damaged or destroyed. An amusement park in Seaside Heights, New Jersey got completely destroyed when a whole roller coaster ended up in the Ocean. Flooding was so extreme in Lower Manhattan that cars piled on top of each other and got completely submerged in water in the streets when extreme flooding took place. In addition to this, the waves were so strong from the hurricane that boats washed ashore in Monmouth Beach, New Jersey. Fires also took place as a result of Hurricane Sandy. A fire in Brooklyn, New York destroyed 110 homes (Jeffery, 2017).  Sand even had to be removed from people’s homes in Mantoloking, New Jersey after the hurricane. Many people were extremely affected by this hurricane and had a hard time recovering. In efforts to try and protect communities in the future from Hurricanes and natural disasters, the Department of Environmental Protection is trying to help reduce greenhouse gas emissions and to help mitigate the threats from sea-level rise. 


(CNBC) 

Collapsed Amusement Park in Seaside Heights, New Jersey. The waves were very intense from this hurricane and led to massive destruction.  


(National Weather Service) 

This graph is a hydrograph from Hurricane Sandy. Information on hurricane winds, rainfall, and the movement of the storm is important to track. The hydrograph shows the height of the tide in New York Harbor at the Battery. 


(CNBC)

This picture shows the destruction caused by Hurricane Sandy. It lifted many homes from their foundation and left streets extremely flooded leaving extreme damage.


(New York Times) 

Birds eye view of Atlantic City from Hurricane Sandy. Houses near the beach were heavily affected by the hurricane and high tides made flooding worse. 


Hurricane Sandy Creeps into Queens | The New York Times

This video shows residents' experience from Hurricane Sandy in Queens, New York. It shows storm footage to help show the severity of the hurricane. Many people chose not to evacuate and residents explained how high the waves got during the hurricane.   


References 

Aftermath of Superstorm Sandy. Department of Environmental Protection. (n.d.). https://dep.nj.gov/sandy-10/

Blake et al. (2013, February 12). Tropical cyclone report : Hurricane Sandy - NHC. National Hurricane Center . https://www.nhc.noaa.gov/data/tcr/AL182012_Sandy.pdf

Bowman et al. (n.d.). Superstorm Sandy – how did it happen and are we prepared for the future?https://seagrant.sunysb.edu/media/sandy12/UUPInsight-Sandy020113.pdf

Jeffery, A. (2017, October 30). Five Years on: A look back at the destruction caused by Superstorm Sandy. CNBC. https://www.cnbc.com/2017/10/30/five-years-on-a-look-back-at-the-destruction-caused-by-superstorm-sandy.html

US Department of Commerce, N. (2024, May 30). Hurricane Sandy. National Weather Service. https://www.weather.gov/okx/hurricanesandy5year


Tuesday, September 17, 2024

1935 Quetta Earthquake


Figure 1: Map of earthquakes in the Quetta region of Pakistan.

  On May 31, 1935, at 3:03 A.M., a 7.6 magnitude earthquake razed the streets of Quetta. Quetta was a mid-sized city in the arid badlands of the province of Balochistan, British India (modern day Pakistan) (Skrine 1936). The city held a strong military presence which was in place to protect the border of British India, which had caused the population to ascend rapidly. The families of the soldiers often immigrated along with the soldiers, as well as merchants and government officials to provide services and city planning. The quick rise in population, as well as the caste system that was prevalent in British India, led to distinct districts that were segregated based upon race and occupation (Global Shelter Cluster 2019). These districts varied in building quality, location, and population density. The poorest district was made of tall, mud and brick buildings and were placed in close proximity to each other. A district was devoted to government officials, and the buildings there were well built. The military districts were the best suited for an earthquake, as they were not on alluvial soil and had many open areas and smaller buildings (Global Shelter Cluster 2019). The earthquake in Quetta was caused by a surface-rupturing left-lateral strike-slip even along the Chaman Fault and the shaking could be felt for up to 100 miles. This region has significant amounts of tectonic activity, as it is in between the Indian, Eurasian, and the Himalayan plates (Reynolds et al. 2019). When the earthquake struck, the poorest districts and the district for government officials was where the shaking was strongest. These districts were built upon alluvial soil, which holds moisture and causes liquefaction to the soil during an earthquake. Since the poorest district had poorly constructed buildings and a high population density, this intense shaking almost completely decimated this district (Global Shelter Cluster 2019). As most people were sleeping when the shaking first occurred, these poorly constructed buildings fell apart on them in their sleep. Those who were awake could often not escape their buildings, as there was a lack of exterior exits (Skrine 1936). The district which hosted the government officials also experienced extensive damage, but the casualties were lessened due to the buildings being more spread apart, which allowed more people to escape their buildings. The military districts survived without much damage, due to the well constructed buildings and due to the soil being drier than the alluvial soil of the poorer districts (Global Shelter Cluster 2019). In the aftermath of this terrible earthquake, 60,000 citizens of Quetta were killed and there was approximately $25 million of damage, adjusted to USD in 2001 (NCEI 2024). 


Figure 2: Diagram of the tectonic activity around Quetta.


There were significant problems in the aftermath of the earthquake, as would be the case in any earthquake with this level of loss of human life and property damage. Immediately, the military declared martial law, set up a hospital, dug up survivors, and opened camps for survivors. The military then cut off the city as a safety measure, to keep people away from disease caused by rotting bodies (Global Shelter Cluster 2019). The military had to ward off looters, who had traveled from the frontier to loot what they could (The Associated Press 1935). Tents and camps were erected, but these tents were not properly prepared for the weather, nor was there anywhere near enough of them. Thousands of people were evacuated by train, though there was significant racial bias during the evacuation, as British citizens were prioritized. A Relief Fund was also established, in which $7.1 million, adjusted to USD in 2018, was raised worldwide to help with reconstruction efforts. Much of this aid also was troubled by racial bias, with British citizens gaining much of the aid. There were significant strides to improve the infrastructure, but during winter, no progress could be made due to improper equipment (Global Shelter Cluster 2019). When reconstruction could resume, the city planners implemented a strict city code to prevent another disastrous event, despite local uproar over the high costs of these improvements. Wider streets, improved sewage systems, exterior exits on buildings, steel-reinforced concrete, one story buildings, and square shaped buildings were all implemented across the city. Squared shaped buildings were found to have collapsed less during the earthquake than rectangular buildings, due to less stress up the corners, explaining the code (Global Shelter Cluster 2019). During an earthquake in 1955, many of these new structures performed admirably and there was significant reduction in deaths and damage (Reynolds et al. 2019).


Figure 3: The destruction caused by the earthquake in Quetta.


        Overall, the response and recovery to this tragedy was admirable in many ways, yet could have improved. The improvements made to the city after the event could have been made prior, if as much care was taken to other citizens as much as British citizens and the military. However, despite the problems caused by racial bias, the military’s response was quick and effective given the scale of the task laid before them. The cutting off of the area prevented the catastrophe from spreading while the military could rescue civilians and establish hospitals and camps. The evacuation could have been more effective, as British citizens were given preferential treatment. The population continued to grow as labor came in to rebuild as well. One of the major problems was the lack of shelter, as well as the available shelter being ineffective in the climate (Global Shelter Cluster 2019). This is an area in which the government was woefully unprepared, and should be improved upon. However, despite the many issues plaguing this disaster, they performed well in the aftermath.

https://www.youtube.com/watch?v=ZY0sabJFsAA

Video: The video briefly shows the destroyed city and the reconstruction of the city. It also shows the living conditions of those displaced by the event, as well as the builders implementing steel reinforced concrete to their buildings to prevent another disaster of this magnitude.

Works Cited

Global Shelter Cluster. (2019, May). Shelter Projects 2017-2018. The Shelter Project. http://shelterprojects.org/shelterprojects2017-2018/ShelterProjects_2017-2018_lowres_web.pdf 

Reynolds, K., Copley, A., & Hussain, E. (2015). Evolution and dynamics of a fold-thrust belt: the Sulaiman Range of Pakistan. Geophysical Journal International, 201(2), 683–710.

Significant Earthquake Information. NCEI Global Historical Hazard Database. (n.d.). https://www.ngdc.noaa.gov/hazel/view/hazards/earthquake/event-more-info/3550

Skrine, C. P. (1936). The Quetta earthquake. The Geographical Journal, 88(5), 414. https://doi.org/10.2307/1785962

The Associated Press. (1935, June 1). 20,000 killed by india quake; city shattered. Chicago Daily Tribune, pp. 1–1.